empty
22.07.2024 05:29 AM
Technical Analysis of Intraday Price Movement of Silver Commodity Asset, Monday July 22 2024.

This image is no longer relevant

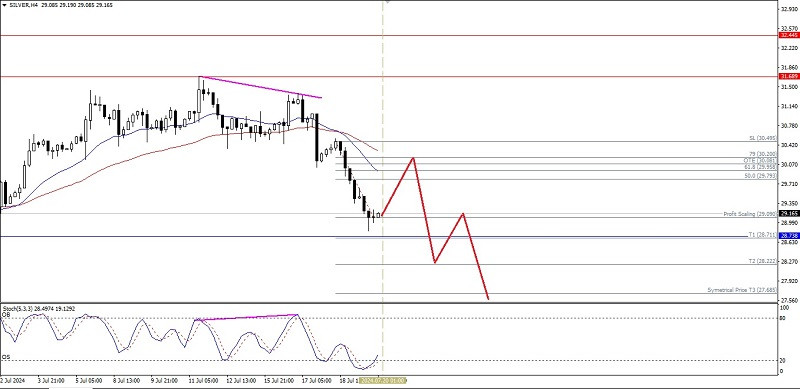
If we look at the 4-hour chart of the Silver commodity asset, we can find an interesting thing where the price movement forms a Higher-Low while the Stochastic Oscillator indicator actually forms a High-High thus creating a hidden deviation condition so that based on this condition it is supported by the EMA 20 which is below the EMA 50 and the price movement is also below the two EMAs, so in the near future Silver has the potential to fall lower to level 28,711. If this level is successfully broken then Silver has the potential to continue its decline to level 28,222 as the main target and 27,685 as the next target to be aimed at, but if On its way to these target levels, suddenly Silver experiences a strengthening correction that breaks above level 30,495, so all the weakening scenarios that have been described previously will become invalid and automatically cancel itself.

(Disclaimer)

Select timeframe
5
min
15
min
30
min
1
hour
4
hours
1
day
1
week
Earn on cryptocurrency rate changes with InstaForex
Download MetaTrader 4 and open your first trade
  • Grand Choice
    Contest by
    InstaForex
    InstaForex always strives to help you
    fulfill your biggest dreams.
    JOIN CONTEST

Recommended Stories

EUR/USD. June 30th. What to Expect from Christine Lagarde's Speech?

On Friday, the EUR/USD pair continued its upward movement. The 127.2% retracement level at 1.1712 proved relatively weak; however, a close above it still allows for the expectation of further

Samir Klishi 12:24 2025-06-30 UTC+2

Forecast for GBP/USD on June 30, 2025

On the hourly chart, the GBP/USD pair traded sideways on Friday. Bullish traders attempted several times to consolidate above the 200.0% retracement level at 1.3749, but without success. A firm

Samir Klishi 12:20 2025-06-30 UTC+2

Technical Analysis for the Week of June 30 – July 5: GBP/USD Currency Pair

Last week, the pair moved upward and tested the support line at 1.3769 (bold blue line), after which the price declined and closed the weekly candle at 1.3719

Stefan Doll 10:44 2025-06-30 UTC+2

Technical Analysis for the Week of June 30 – July 5: EUR/USD Currency Pair

Last week, the pair moved upward and broke through the historical resistance level at 1.1710 (blue dashed line), closing the weekly candle at 1.1718. In the upcoming week, the price

Stefan Doll 10:40 2025-06-30 UTC+2

Indicator Analysis: Daily Overview for GBP/USD on June 30, 2025

On Friday, the pair moved downward and nearly tested the 23.6% retracement level at 1.3675 (yellow dashed line), after which the price rebounded upward and closed the daily candle

Stefan Doll 10:37 2025-06-30 UTC+2

Indicator Analysis: Daily Overview for EUR/USD on June 30, 2025

On Friday, the pair moved upward and tested the 161.8% target level at 1.1746 (red dashed line), after which the price reversed downward and closed the daily candle at 1.1718

Stefan Doll 10:33 2025-06-30 UTC+2

Forex forecast 30/06/2025: EUR/USD, USDX, USD/JPY, Gold and Bitcoin

Useful links: My other articles are available in this section InstaForex course for beginners Popular Analytics Open trading account Important: The begginers in forex trading need to be very careful

Sebastian Seliga 10:30 2025-06-30 UTC+2

Bearish MACD Divergence in GBP/USD has the potential to trigger a weakening, Monday, June 30, 2025.

GBP/USD – Monday, June 30, 2025. Although there is a potential for GBP/USD to strengthen due to the weakening of the USD (Dovish issue), the emergence of Divergence in MACD

Arief Makmur 08:25 2025-06-30 UTC+2

Level 3288.270 has the potential to tests by XAU/USD, Monday, June 30, 2025.

XAU/USD – Monday, June 30 2025 Geopolitical tensions have begun to ease, causing funds to flow out of Safe Haven instruments such as XAU/USD, thus creating pressure on XAU/USD with

Arief Makmur 08:25 2025-06-30 UTC+2

EUR/USD Forecast for June 30, 2025

EUR/USD On Friday, the euro consolidated above the 1.1692 level. The Marlin oscillator is moving sideways, but the upward potential has not been exhausted, and the price continues to rise

Laurie Bailey 05:49 2025-06-30 UTC+2
Can't speak right now?
Ask your question in the chat.
Widget callback
 

Dear visitor,

Your IP address shows that you are currently located in the USA. If you are a resident of the United States, you are prohibited from using the services of InstaFintech Group including online trading, online transfers, deposit/withdrawal of funds, etc.

If you think you are seeing this message by mistake and your location is not the US, kindly proceed to the website. Otherwise, you must leave the website in order to comply with government restrictions.

Why does your IP address show your location as the USA?

  • - you are using a VPN provided by a hosting company based in the United States;
  • - your IP does not have proper WHOIS records;
  • - an error occurred in the WHOIS geolocation database.

Please confirm whether you are a US resident or not by clicking the relevant button below. If you choose the wrong option, being a US resident, you will not be able to open an account with InstaForex anyway.

We are sorry for any inconvenience caused by this message.