GBP/USD
Analysis:
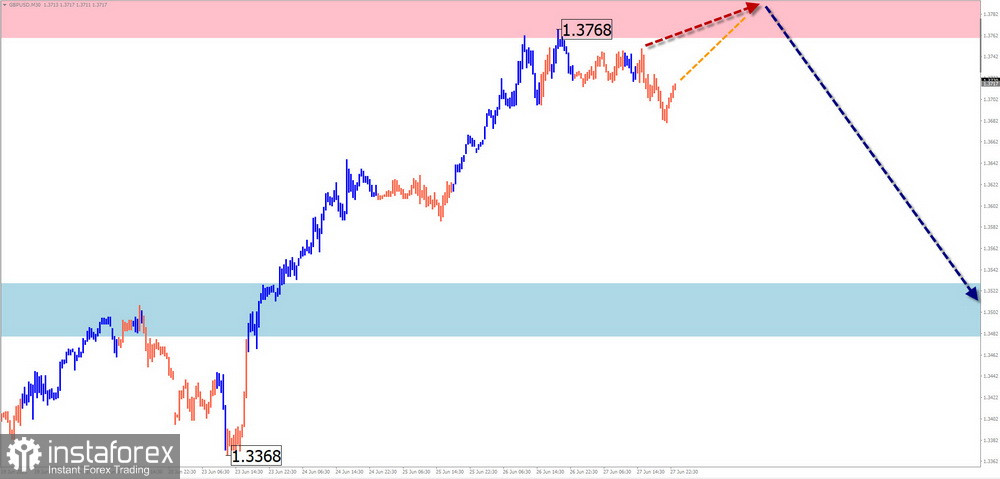
The structure of the upward wave in GBP/USD that began earlier this year currently shows no signs of incompletion. The price has reached the lower boundary of a major potential reversal zone. After a pullback, the pair has been forming an upward segment since June 18, with its wave level exceeding the retracement.
Forecast:
Sideways movement is likely in the coming trading days, with a potential return to the resistance zone. A reversal and renewed bearish movement toward the support levels may follow.
Potential Reversal Zones
- Resistance: 1.3760 / 1.3810
- Support: 1.3530 / 1.3480
Recommendations:
- Selling: Possible upon confirmation of reversal signals near the resistance zone from your trading systems.
- Buying: Trades in this direction have limited potential.
AUD/USD
Analysis:
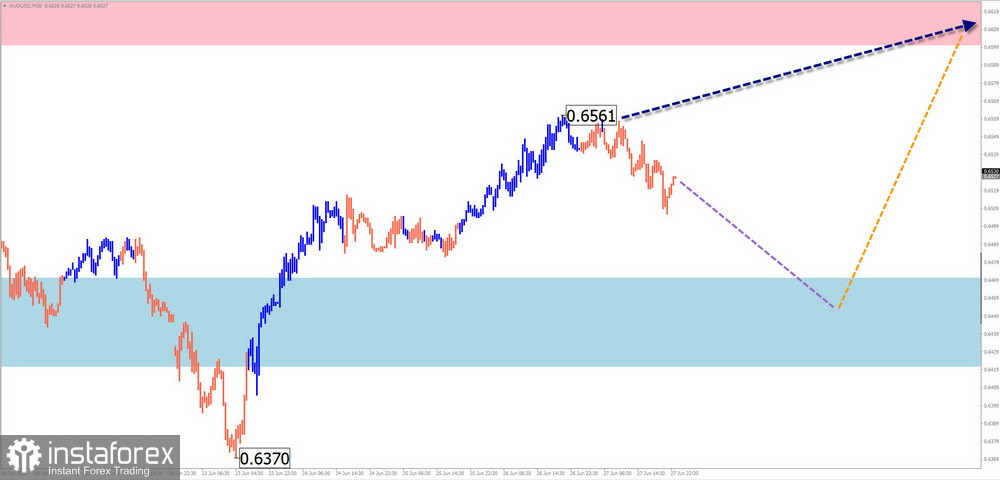
Since April, the price movements of the Australian dollar have been following an upward wave pattern. The bearish wave that began in late May is forming the (B) corrective phase in a horizontal formation. The bullish leg from June 23 has reversal potential.
Forecast:
Sideways movement is expected during the upcoming week. A brief decline toward support is possible in the next few days. Toward the end of the week, the likelihood of a reversal and renewed growth toward the resistance zone increases.
Potential Reversal Zones
- Resistance: 0.6600 / 0.6650
- Support: 0.6470 / 0.6420
Recommendations:
- Selling: May be used intraday in small volumes; limited potential.
- Buying: Can be considered after confirmed reversal signals near the support zone.
USD/CHF
Analysis:
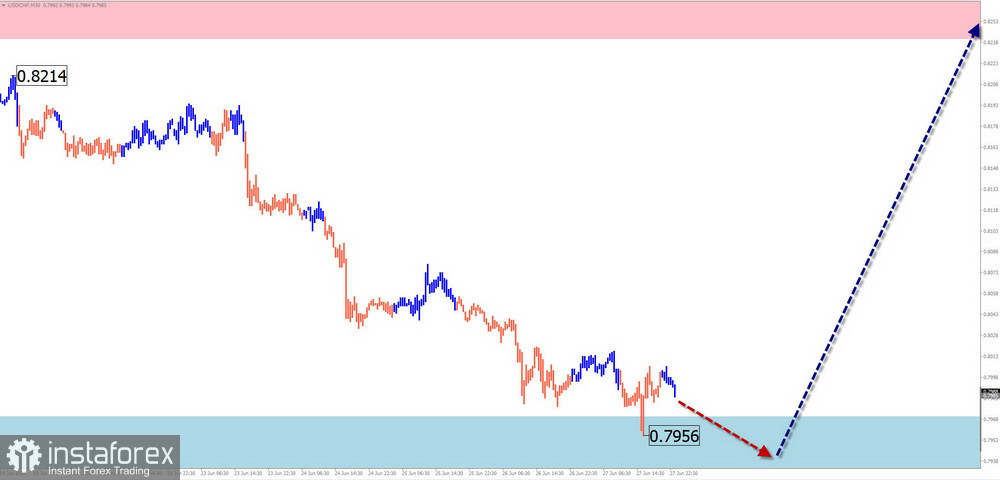
Since the start of the year, USD/CHF has been moving within a descending wave. The bearish leg that began in May forms a correction within the main trend. At the time of analysis, this move is still incomplete, missing the final segment (C).
Forecast:
The descending phase is expected to conclude in the coming week. Sideways movement within the support range may occur in the next few days, followed by a likely reversal and upward move toward the resistance zone by the end of the week.
Potential Reversal Zones
- Resistance: 0.8240 / 0.8290
- Support: 0.7970 / 0.7920
Recommendations:
- Selling: Carries high risk and low potential.
- Buying: Can be considered after confirmed reversal signals near support.
EUR/JPY
Analysis:
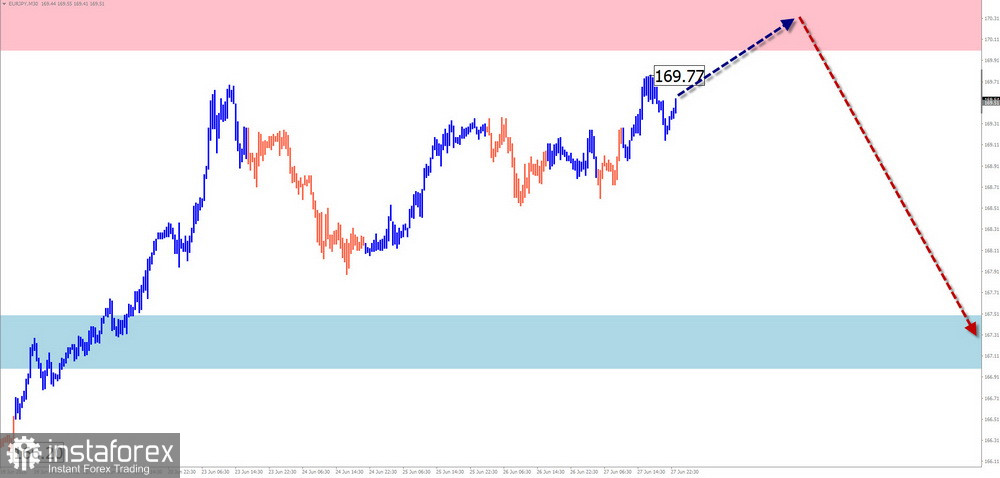
Since August last year, EUR/JPY has been forming an upward wave. The current incomplete segment, which began on February 28, is approaching a strong potential reversal zone. Although a correction is due, no reversal signals are yet visible on the chart.
Forecast:
The current rise is expected to continue this week until the calculated resistance is reached. A brief sideways move may follow. Toward the end of the week, increased volatility, a trend shift, and a decline toward support are likely.
Potential Reversal Zones
- Resistance: 170.00 / 170.50
- Support: 167.50 / 167.00
Recommendations:
- Selling: Possible only after confirmed reversal signals from your trading systems.
- Buying: Not recommended for the coming days; no favorable conditions present.
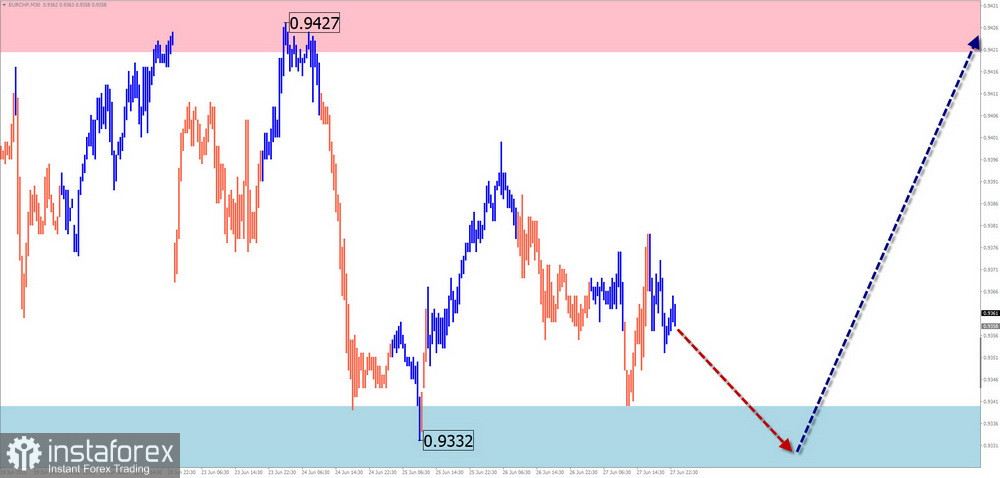
EUR/CHF
Analysis:
Since April, EUR/CHF has been trending upward. The current upward segment from June 13 is forming the final leg (C) of the main trend. The intermediate correction within this segment is nearing completion.
Forecast:
A reversal and resumption of the upward trend toward the resistance zone are expected this week. A brief sideways movement near the support zone is possible in the coming days. Increased momentum and growth are more likely in the second half of the week.
Potential Reversal Zones
- Resistance: 0.9420 / 0.9470
- Support: 0.9340 / 0.9290
Recommendations:
- Buying: May be considered once reversal signals appear from your systems near support.
- Selling: Not recommended in the coming days.
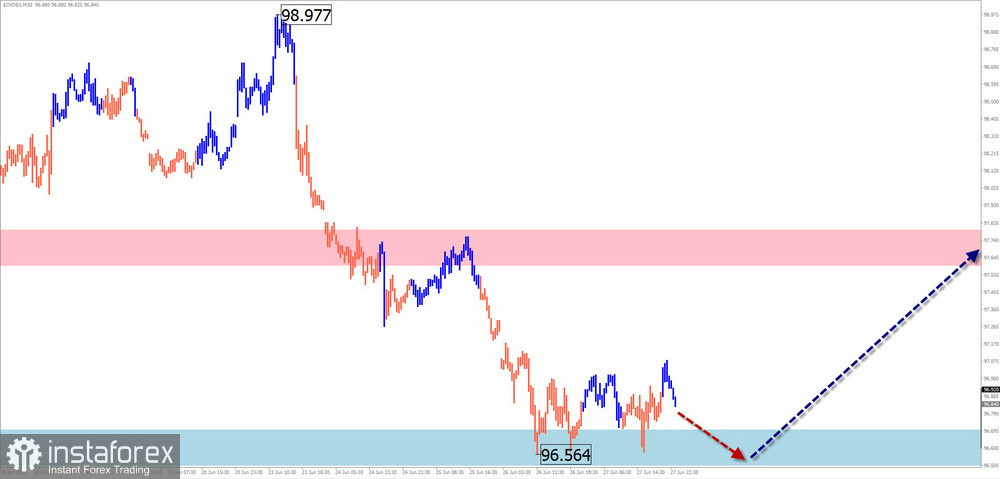
US Dollar Index (USD Index)
Analysis:
Since February, the US Dollar Index has been trending downward. A correction has been developing since mid-April in a shifting horizontal pattern. The index has reached the upper boundary of a strong potential monthly reversal zone. The correction wave is missing its final segment (C).
Forecast:
The current flat trend in the US dollar is expected to conclude by the end of the week. A reversal and upward move may occur near the calculated support zone. The resistance zone marks the upper limit of the expected weekly movement.
Potential Reversal Zones
- Resistance: 97.60 / 97.80
- Support: 96.70 / 96.50
Recommendations:
A trend reversal in the US dollar is likely in the coming days. This phase may last for several weeks. It is recommended to exit active trades and prepare for the weakening of national currencies in major pairs.
Notes: In Simplified Wave Analysis (SWA), all waves consist of 3 segments (A-B-C). Only the latest, incomplete wave is analyzed on each timeframe. Solid arrows indicate completed structures; dashed arrows show expected movements.
Important: The wave algorithm does not account for the duration of price movements over time!