empty
05.02.2024 05:32 AM
Trading Signals for BITCOIN (BTC/USD) on February 5-7, 2024: buy above $ 42,187 (3/8 Murray - 200 EMA)

This image is no longer relevant

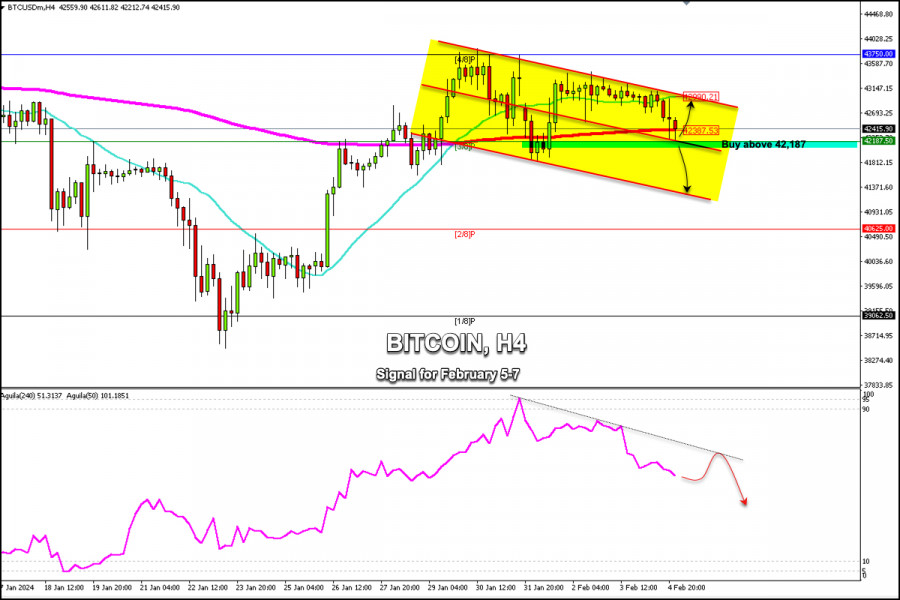
Early in the European session, Bitcoin (BTC/USD) is trading around the 200 EMA and above 3/8 Murray. We can see in the chart above that BTC is trading within the downtrend channel forming since January 27.

Practically, in the last few sessions, Bitcoin has been consolidating below the top of the bearish channel, with low volume and a decrease in volatility. Now we observe a technical rebound after having reached 42,000.

If Bitcoin falls below 3/8 Murray (42,187) or consolidates below $42,000 in the next few hours, we could expect a continuation of the bearish movement and the token could reach the low of January 28 around 41,600.

If the downward pressure prevails, the BTC price could approach the bottom of the downtrend channel at 41,150 and could ultimately reach the psychological level of $40,000 or around 2/8 Murray.

In case Bitcoin recovers, we should expect a sharp break above the 21 SMA at 42,990 and a break of the downtrend channel forming since January 27. Then, we could expect BTC to reach 43,750, a level that has become a strong barrier whose break could lead to the advance of Bitcoin in the short term and a rebound to $45,000.

As Bitcoin trades below 43,750, the outlook will remain negative for the instrument and any technical bounce could be seen as an opportunity to sell.

Below the 200 EMA (42,400) on the H4 chart, the outlook could be even more bearish and we could expect it to reach the low of January 23 around $38,500. The price could accelerate its fall. If BTC breaks this level, it could approach $35,000.

Technically, the eagle indicator has been giving a negative signal since January 30. So, if Bitcoin continues trading below $43,750, it is likely either to have a strong technical correction or a trade in the range between $43,750 and $40,625.

Summary
Urgency
Analytic
Dimitrios Zappas
Start trade
รับผลกำไรจากการเปลี่ยนแปลงอัตราสกุลเงินดิจิทัลกับ InstaForex.
ดาวน์โหลด MetaTrader 4 และเปิดการซื้อขายครั้งแรกของคุณ.
GBP/USD: ทำไมค่าเงินปอนด์ถึงกำลังขึ้น? ค่าเงินปอนด์ในคู่ GBP/USD กำลังเคลื่อนไหวขึ้นอย่างมั่นคง โดยอัพเดตจุดสูงสุดในท้องถิ่น ราคาขึ้นมาต่อเนื่องจนวันพุธคู่เงินได้เข้าใกล้กรอบของพื้นที่ 1.36 ขณะที่เมื่อวันจันทร์ที่ผ่านมาราคายังอยู่ที่บริเวณ 1.33 โดยมีจุดต่ำสุดที่ 1.3398 การเคลื่อนไหวด้านราคานี้ไม่ได้เกิดขึ้นแค่เพราะเงินดอลลาร์สหรัฐอ่อนค่าลง แต่ยังรวมถึงค่าเงินปอนด์ที่แข็งค่าขึ้น ซึ่งตอบสนองเชิงบวกต่อรายงานตลาดแรงงานของสหราชอาณาจักร ส่วนค่าเงินดอลลาร์เองก็กำลังสูญเสียมูลค่าเนื่องจากการคาดการณ์ด้านนโยบายที่มีแนวโน้มไปในทางผ่อนคลายมากขึ้น หลังจากที่มีการเผยแพร่ข้อมูล
  • Grand Choice
    Contest by
    InstaForex
    InstaForex always strives to help you
    fulfill your biggest dreams.
    เข้าร่วมการแข่งขัน


บทความแนะนำ

สัญญาณซื้อขาย EUR/USD สำหรับวันที่ 13-16 สิงหาคม 2025: ขายต่ำกว่า 1.1730 (200 EMA - 8/8 Murray)

ยูโร หลังจากพบแนวรับที่แข็งแกร่งรอบระดับ 6/8 ของ Murray มีการฟื้นตัวทางเทคนิคและตอนนี้บรรลุถึงระดับแนวต้านรอบ 8/8 ของ Murray ระดับนี้มีแนวโน้มที่จะเป็นอุปสรรคที่แข็งแกร่ง เนื่องจากตรงกับส่วนยอดของช่องแนวโน้มขาลง หากยูโรประกอบตัวอยู่ต่ำกว่าระดับ 1.1730 ในชั่วโมงข้างหน้า จะถือเป็นโอกาสในการขายเพื่อเป้าหมายที่

Dimitrios Zappas 18:09 2025-08-13 UTC+2

สัญญาณการซื้อขายสำหรับ BITCOIN ระหว่างวันที่ 13-16 สิงหาคม 2025: ขายต่ำกว่า $122,100 (7/8 มิวเรย์ - 21 SMA)

บิทคอยน์มีการเคลื่อนไหวในทางบวกที่แข็งแกร่งในช่วงตลาดอเมริกา โดยไปถึงระดับ $122,200 ซึ่งเป็นระดับสำคัญที่เห็นครั้งล่าสุดในวันที่ 9 สิงหาคม ตั้งแต่นั้นมา เราได้สังเกตว่าบิทคอยน์อยู่ในช่วงปรับฐานทางเทคนิค และมีแนวโน้มที่จะปรับฐานต่อไปจนกว่าจะถึงจุดต่ำสุดของช่องแนวโน้มขาขึ้นรอบ ๆ $120,000 หากบิทคอยน์ไม่สามารถทะลุเหนือระดับ 7/8 ของ Murray

Dimitrios Zappas 18:02 2025-08-13 UTC+2

สัญญาณซื้อขายสำหรับทองคำ (XAU/USD) ระหว่างวันที่ 13-16 สิงหาคม 2025: ขายต่ำกว่า $3,363 (200 EMA - 21 SMA)

ทองคำกำลังซื้อขายอยู่ราวๆ 3,363 หลังจากเด้งกลับจากระดับต่ำสุดที่ประมาณ 3,328 XAU/USD พบแนวรับที่ดีรอบๆ จุดต่ำสุดของช่องแนวโน้มขาขึ้น และตั้งแต่นั้นมาก็ได้แตะ 3,370 อย่างไรก็ตาม ทองคำอาจประสบปัญหาขึ้นต่อไป เนื่องจากเราเห็นระดับความอ่อนแรงในกราฟ H4 หากทองคำซื้อขายต่ำกว่า 3,363

Dimitrios Zappas 18:00 2025-08-13 UTC+2

การพยากรณ์อัตราแลกเปลี่ยน 13/08/2025: EUR/USD, USD/JPY, GBP/USD, ทองคำ, Ethereum และ Bitcoin

ลิงก์ที่มีประโยชน์: บทความอื่นๆ ของฉันอยู่ในส่วนนี้ คอร์ส InstaForex สำหรับผู้เริ่มต้น การวิเคราะห์ยอดนิยม เปิดบัญชีซื้อขาย ข้อสำคัญ: ผู้เริ่มต้นในตลาด Forex ต้องระมัดระวังอย่างมากเมื่อทำการตัดสินใจในการเข้าสู่ตลาด ก่อนการเผยแพร่รายงานสำคัญ ควรหลีกเลี่ยงการเข้าสู่ตลาดเพื่อป้องกันการพบกับความผันผวนอย่างรุนแรงของตลาดที่เกิดจากความผันผวนที่เพิ่มขึ้น หากคุณตัดสินใจที่จะแตะตลาดในขณะที่มีการประกาศข่าว

Sebastian Seliga 15:43 2025-08-13 UTC+2

การคาดการณ์สำหรับ EUR/USD ในวันที่ 13 สิงหาคม 2025

เมื่อวันอังคาร คู่สกุลเงิน EUR/USD ยังคงเคลื่อนไหวขึ้นต่อหลังจากดีดตัวขึ้นจากระดับ Fibonacci retracement 50.0% ที่ 1.1590 นอกจากนี้ยังสามารถยืนเหนือโซนแนวต้านที่ 1.1637–1.1645 และไปถึงระดับ 1.1695 การดีดตัวจากระดับนี้จะเป็นประโยชน์ต่อสกุลเงินสหรัฐและสามารถนำไปสู่การลดลงไปยังโซน 1.1637–1.1645

Samir Klishi 11:56 2025-08-13 UTC+2

การคาดการณ์สำหรับ GBP/USD ในวันที่ 13 สิงหาคม 2025

ในกราฟรายชั่วโมง คู่เงิน GBP/USD ในวันอังคารอีกครั้งหนึ่งดีดขึ้นจากโซนแนวรับที่ 1.3416–1.3425 และเปลี่ยนเป็นผลประโยชน์ของปอนด์ จากนั้นกลับมามีเสถียรภาพเหนือระดับ 76.4% ของ Fibonacci ที่ 1.3482 ดังนั้น การเคลื่อนไหวขึ้นอาจดำเนินต่อในวันนี้ไปยังระดับ retracement

Samir Klishi 11:48 2025-08-13 UTC+2

GBP/USD: การวิเคราะห์จากตัวชี้วัด ณ วันที่ 13 สิงหาคม 2025

การวิเคราะห์แนวโน้ม (รูปที่ 1) ในวันพุธ จากระดับ 1.3495 (ราคาปิดรายวันของเมื่อวาน) ตลาดอาจมีการเคลื่อนไหวขึ้นไปต่อเนื่องไปยัง 1.3522 ซึ่งเป็นระดับการคืนตัวที่ 85.4% (เส้นประสีแดง) เมื่อทดสอบระดับนี้ ราคาอาจขึ้นต่อไปยัง 1.3587

Stefan Doll 11:45 2025-08-13 UTC+2

EUR/USD: การวิเคราะห์จากอินดิเคเตอร์ในวันที่ 13 สิงหาคม 2025

การวิเคราะห์แนวโน้ม (รูปที่ 1) ในวันพุธ จากระดับ 1.1673 (จุดปิดของกราฟแท่งเทียนรายวันเมื่อวานนี้) ตลาดอาจมีการเคลื่อนไหวขึ้นต่อไปยังระดับ 1.1697 ซึ่งเป็นระดับการปรับตัว 76.4% (เส้นประสีเหลือง) เมื่อทดสอบระดับนี้แล้ว ราคาอาจมีการขึ้นต่อไปยังระดับ 1.1731

Stefan Doll 11:38 2025-08-13 UTC+2

XAU/USD ยังคงอยู่ภายใต้แรงกดดัน แม้ว่าศักยภาพในการแข็งค่าจะมีจำกัด วันพุธที่ 13 สิงหาคม 2025

[XAU/USD] – [วันพุธที่ 13 สิงหาคม 2025] XAU/USD ดูเหมือนกำลังพยายามทดสอบระดับแนวรับที่ใกล้ที่สุด ซึ่งได้รับการยืนยันโดยตัวบ่งชี้ RSI (14) ที่อยู่ในพื้นที่ Neutral-Bearish และทั้งสอง

Arief Makmur 08:25 2025-08-13 UTC+2

แม้ว่าจะมีความเป็นไปได้ในการปรับฐานลง แต่ AUD/USD ยังคงมีแนวโน้มแข็งแกร่ง วันพุธที่ 13 สิงหาคม 2025

[AUD/USD] – [วันพุธที่ 13 สิงหาคม 2025] สำหรับตำแหน่งของ AUD/USD ขณะนี้ EMA(50) ยังคงอยู่เหนือระดับ EMA(200) อีกทั้ง RSI (140)

Arief Makmur 08:25 2025-08-13 UTC+2
หากไม่สะดวกคุยในตอนนี้
ระบุคำถามไว้ได้ใน แชท.
Widget callback
 

Dear visitor,

Your IP address shows that you are currently located in the USA. If you are a resident of the United States, you are prohibited from using the services of InstaFintech Group including online trading, online transfers, deposit/withdrawal of funds, etc.

If you think you are seeing this message by mistake and your location is not the US, kindly proceed to the website. Otherwise, you must leave the website in order to comply with government restrictions.

Why does your IP address show your location as the USA?

  • - you are using a VPN provided by a hosting company based in the United States;
  • - your IP does not have proper WHOIS records;
  • - an error occurred in the WHOIS geolocation database.

Please confirm whether you are a US resident or not by clicking the relevant button below. If you choose the wrong option, being a US resident, you will not be able to open an account with InstaForex anyway.

We are sorry for any inconvenience caused by this message.