empty
02.01.2023 12:20 PM
Technical analysis of EUR/USD on January 2023

Trend-following analysis

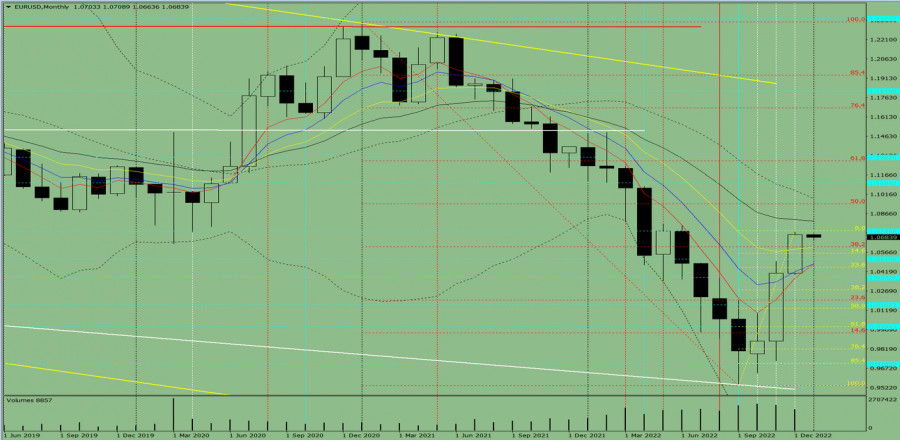
In January, EUR/USD is expected to move higher from 1.0706, the level of closing the December one-month high, to the target at 1.0941, which is the 50.0% Fibonacci retracement level plotted by the red dotted line. Once this level is tested, the instrument will continue its rise to 1.1104, the historic resistance level plotted by the blue dotted line. After this level is tested, we could expect a downward retracement.

This image is no longer relevant

Picture 1, one-month chart

Indicator analysis

  • Indicator analysis – up
  • Fibonacci levels – up
  • A trading volume - up
  • Candlestick analysis – up
  • Trend-following analysis – up
  • Bollinger bands – up

The conclusion from the complex analysis is that EUR/USD is likely to trade higher.

The one-month chart of EUR/USD draws traders to the conclusion that the overall trend is going to be bullish. The one-month white candlestick lacks the first lower shadow in the first week. The second upper shadow is also missing on the final week.

The basic scenario. EUR/USD is expected to move higher from 1.0706, the level of closing the December one-month candlestick, to the target at 1.0941, which is the 50.0% Fibonacci retracement level plotted by the red dotted line. Once this level is tested, the instrument will continue its rise to 1.1104, the historic resistance level plotted by the blue dotted line. After this level is tested, we could expect a downward retracement.

Alternative scenario. EUR/USD might also move higher from 1.0706, the level of closing the December one-month candlestick, towards the target of 1.0941, which is the 50.0% Fibonacci retracement level plotted by the red dotted line. After this level is tested, the price will retrace downwards. 1.0809 serves as a 21-period moving average plotted by the black thin line.

Stefan Doll,
ผู้เชี่ยวชาญด้านการวิเคราะห์ของ InstaForex
© 2007-2025
เลือกช่วงเวลา
5
นาที
15
นาที
30
นาที
1
ชั่วโมง
4
ชั่วโมง
1
วัน
1
สัปดาห์
รับผลกำไรจากการเปลี่ยนแปลงอัตราสกุลเงินดิจิทัลกับ InstaForex.
ดาวน์โหลด MetaTrader 4 และเปิดการซื้อขายครั้งแรกของคุณ.
  • Grand Choice
    Contest by
    InstaForex
    InstaForex always strives to help you
    fulfill your biggest dreams.
    เข้าร่วมการแข่งขัน


บทความแนะนำ

การคาดการณ์ EUR/USD สำหรับวันที่ 27 มิถุนายน 2025

EUR/USD เมื่อวานนี้ มีการเปิดเผยข้อมูลที่น่าเป็นห่วงจากสหรัฐฯ โดย GDP ในไตรมาสแรกหดตัวลง 0.5% เมื่อเปรียบเทียบกับที่คาดการณ์ไว้ว่า -0.2% อัตราเงินเฟ้อที่วัดจากค่าใช้จ่ายการบริโภคส่วนบุคคลพื้นฐาน (PCE) ในช่วงเวลาเดียวกันเพิ่มขึ้นจาก 2.6% เป็น 3.5%

Laurie Bailey 05:13 2025-06-27 UTC+2

การคาดการณ์ GBP/USD สำหรับวันที่ 27 มิถุนายน 2025

GBP/USD เงินปอนด์อังกฤษกำลังเพิ่มขึ้น แต่ตัวช่วยไปข้างหน้าอย่าง Marlin oscillator ค่อนข้างอ่อนแรง ไม่ใช่แค่เป้าหมายที่ต้องการ — เช่น 1.3834, 1.3935 และอื่นๆ — ที่อยู่ข้างหน้าเท่านั้น แต่ยังมีกับดักที่อาจจะเป็นโอกาสให้ฝั่งผู้ขายกลับมาโจมตีอย่างไม่หยุดหย่อนอีกด้วย

Laurie Bailey 05:07 2025-06-27 UTC+2

การพยากรณ์ USD/JPY สำหรับวันที่ 27 มิถุนายน 2025

USD/JPY เช้าวันนี้ ข้อมูล CPI แกนกลางของโตเกียวแสดงให้เห็นถึงการลดลงของอัตราเงินเฟ้อสำหรับการประเมินเดือนมิถุนายน: ดัชนีแกนกลางลดลงจาก 3.6% ต่อปี (y/y) เป็น 3.1% ต่อปี (โดยมีการคาดการณ์อยู่ที่ 3.3% ต่อปี)

Laurie Bailey 05:04 2025-06-27 UTC+2

สัญญาณการเทรดสำหรับ EUR/USD วันที่ 26-28 มิถุนายน 2025: ขายต่ำกว่า 1.1730 (ซื้อมากเกินไป - 8/8 Murray)

หากราคายูโรยืนที่ต่ำกว่า 1.1735 แนวโน้มอาจเป็นลบในอีกไม่กี่วันข้างหน้า เราสามารถเปิดสถานะขายโดยมีเป้าหมายที่ระดับ 7/8 ของ Murray ที่ 1.1596 และที่ระดับปลายของช่องแนวโน้มขาขึ้นที่ประมาณ 1.1540 ในที่สุด EUR/USD อาจถึงระดับ 6/8

Dimitrios Zappas 18:42 2025-06-26 UTC+2

สัญญาณการซื้อขายสำหรับทองคำ (XAU/USD) วันที่ 26-28 มิถุนายน 2025: ขายต่ำกว่า $3,335 (21 SMA - 200 EMA)

ในช่วงต้นของตลาดอเมริกา ราคาทองคำกำลังซื้อขายอยู่รอบๆ 3,313 โดยมีการปรับฐานทางเทคนิคที่แข็งแกร่งหลังจากที่แตะถึง 3,350 ในช่วงตลาดยุโรป ทองคำอยู่ต่ำกว่าค่าเฉลี่ยเคลื่อนที่ 21 วัน (21SMA) และต่ำกว่าค่าเฉลี่ยเคลื่อนที่ 200 วัน (200 EMA)

Dimitrios Zappas 18:40 2025-06-26 UTC+2

พยากรณ์อัตราแลกเปลี่ยน วันที่ 26/06/2025: EUR/USD, USD/JPY, USDX, น้ำมัน และ Ethereum

ลิงก์ที่มีประโยชน์: บทความอื่น ๆ ของฉันสามารถดูได้ในส่วนนี้ คอร์ส InstaForex สำหรับผู้เริ่มต้น การวิเคราะห์ยอดนิยม เปิดบัญชีซื้อขาย สำคัญ: ผู้เริ่มต้นในตลาดแลกเปลี่ยนเงินตราต่างประเทศควรระมัดระวังอย่างมากเมื่อทำการตัดสินใจเกี่ยวกับการเข้าสู่ตลาด ก่อนที่จะมีการประกาศรายงานที่สำคัญ ควรหลีกเลี่ยงการเข้าตลาด เพื่อป้องกันไม่ให้เจอกับความผันผวนที่รุนแรงเนื่องจากความอ่อนไหวที่เพิ่มขึ้น หากคุณตัดสินใจที่จะทำการซื้อขายในระหว่างที่มีการเผยแพร่ข่าว

Sebastian Seliga 12:18 2025-06-26 UTC+2

EUR/USD – 26 มิถุนายน คำกล่าวของพาวเวลยังคงไม่เปลี่ยนแปลง

ในวันพุธ คู่สกุลเงิน EUR/USD ยังคงมีการเคลื่อนไหวขึ้น และเช้าวันพฤหัสบดีก็ได้ไปถึงระดับฟีโบนัชชี่ 127.2% ที่ 1.1712 การสะท้อนกลับจากระดับนี้อาจทำให้เกิดการกลับตัวในความโปรดปรานของดอลลาร์สหรัฐฯ และการลดลงสู่ระดับ 1.1645 และ 1.1574 หากคู่สกุลเงินสามารถยืนเหนือ 1.1712

Samir Klishi 11:17 2025-06-26 UTC+2

GBP/USD. 26 มิถุนายน. รายงาน GDP ของสหรัฐฯจะเปลี่ยนแปลงสิ่งใดไหม?

บนแผนภูมิรายชั่วโมง, คู่สกุลเงิน GBP/USD ในวันพุธได้รักษาตำแหน่งเหนือโซนความต้านทานที่ 1.3611–1.3633 และทำการเคลื่อนที่ขึ้นไปยังระดับ Fibonacci ถัดไป 200.0% ณ 1.3749 การตอบแทนแรงดันจากระดับนี้จะสนับสนุนดอลลาร์สหรัฐฯ และนำไปสู่การลดลงอย่างเป็นมาณพอ แต่หมียังคงหายจากตลาดอย่างมาก การรักษาอย่างเป็นทางการเหนือ

Samir Klishi 10:48 2025-06-26 UTC+2

ทองคำ: ทำไมราคาทองคำถึงกลับมาสูงขึ้นอีกครั้ง?

ทองคำกำลังได้รับแรงหนุนอีกครั้งจากปัจจัยหลักสองประการ ปัจจัยแรกคือความเสี่ยงอย่างต่อเนื่องของความล้มเหลวในการเจรจาระหว่างเตหะรานและเทลอาวีฟ ปัจจัยที่สองเกี่ยวข้องกับความอ่อนแอเรื้อรังของค่าเงินดอลลาร์สหรัฐ ในขณะที่เศรษฐกิจอเมริกากำลังเข้าสู่ภาวะถดถอย ซึ่งอาจยืดเยื้อไปอีกระยะเวลานาน และความไม่แน่นอนเกี่ยวกับผลกระทบระดับโลกในอนาคตของนโยบายภาษีศุลกากรของ Donald Trump ในเชิงเทคนิค ราคาทองคำยังคงอยู่ในแนวโน้มขาขึ้นระยะยาว แรงขับเคลื่อนที่เป็นขาขึ้นจากสาเหตุดังกล่าวอาจดำเนินต่อไปหลังจากที่เกิดการทะลุและยืนเหนือระดับ 3340.00 ราคากำลังเคลื่อนไหวอยู่เหนือเส้นกลางของ Bollinger Bands

Pati Gani 09:21 2025-06-26 UTC+2

คู่สกุลเงิน USD/CAD ยังคงอ่อนค่าลงแม้ว่าจะมีโอกาสในการทดสอบแนวต้านแบบไดนามิกอีกครั้งในวันพฤหัสบดีที่ 26 มิถุนายน 2025

USD/CAD – พฤหัสบดีที่ 26 มิถุนายน 2025 USD/CAD กำลังเคลื่อนไหวในแนวโน้มอ่อนค่าลง แม้ว่าจะมีศักยภาพในการฟื้นตัวเป็นบางช่วงในรูปแบบของการกลับตัวก็ตาม ระดับสำคัญ 1. แนวต้าน 2: 1.37724

Arief Makmur 05:11 2025-06-26 UTC+2
หากไม่สะดวกคุยในตอนนี้
ระบุคำถามไว้ได้ใน แชท.
Widget callback
 

Dear visitor,

Your IP address shows that you are currently located in the USA. If you are a resident of the United States, you are prohibited from using the services of InstaFintech Group including online trading, online transfers, deposit/withdrawal of funds, etc.

If you think you are seeing this message by mistake and your location is not the US, kindly proceed to the website. Otherwise, you must leave the website in order to comply with government restrictions.

Why does your IP address show your location as the USA?

  • - you are using a VPN provided by a hosting company based in the United States;
  • - your IP does not have proper WHOIS records;
  • - an error occurred in the WHOIS geolocation database.

Please confirm whether you are a US resident or not by clicking the relevant button below. If you choose the wrong option, being a US resident, you will not be able to open an account with InstaForex anyway.

We are sorry for any inconvenience caused by this message.