empty
08.05.2025 07:19 PM
EUR/USD: Trading Plan for the U.S. Session on May 8th (Review of Morning Trades)

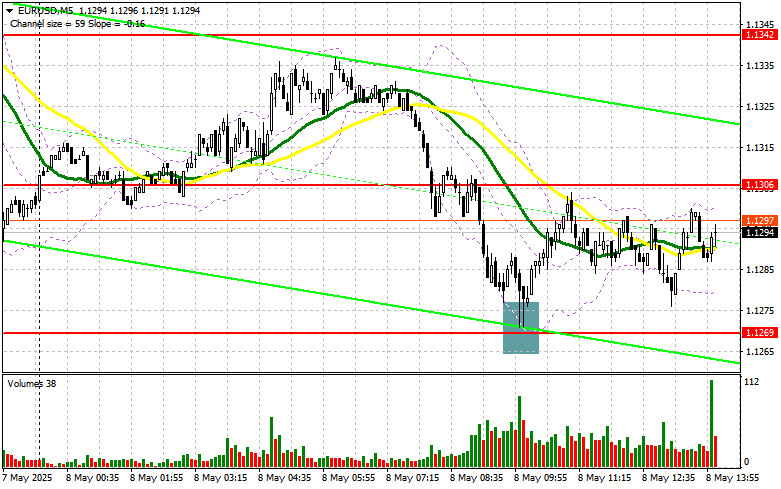
In my morning forecast, I focused on the 1.1269 level and planned to make market entry decisions from it. Let's take a look at the 5-minute chart and analyze what happened. A decline followed by a false breakout around 1.1269 led to a long entry on the euro, resulting in a 30-point rise in the pair. The technical picture was not revised for the second half of the day.

This image is no longer relevant

To open long positions on EUR/USD:

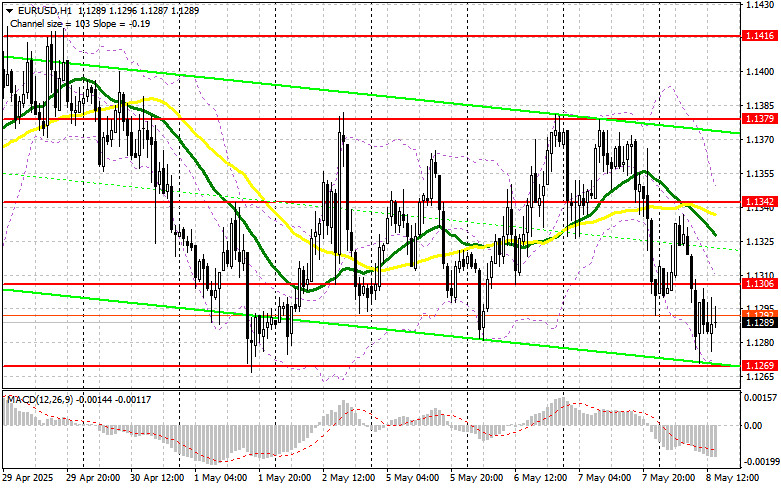
Strong industrial production data from Germany failed to help the euro deal with the pressure that mounted yesterday after the U.S. Federal Reserve left interest rates unchanged. There are no significant U.S. statistics in the second half of the day, so the euro may get a brief respite. Data is expected on weekly initial jobless claims, nonfarm productivity, and unit labor costs. If the data is strong, the euro will likely continue to fall, shifting the focus again to defending the nearest support at 1.1269. A false breakout there, as analyzed earlier, will be a reason to buy EUR/USD with the prospect of recovering to the 1.1306 level, which was missed earlier in the day. A breakout and retest of this range will confirm a valid entry point with a move toward the 1.1342 level. The most distant target will be 1.1379, where I plan to take profit.

If EUR/USD declines and there is no activity near 1.1269, pressure on the pair will increase, potentially triggering a sharper drop. In that case, bears could reach 1.1219. Only after a false breakout at that level will I consider buying the euro. I also plan to open long positions from 1.1164 immediately on a rebound, targeting a 30–35-point intraday correction.

To open short positions on EUR/USD:

Euro sellers have proven their presence in the market and are aiming for the lower boundary of the sideways channel. A breakout from this range would establish a new bearish trend. If the euro rises after the data, bears will have to reaffirm their dominance around 1.1306. Only a false breakout there will be a reason to short with a target at 1.1269. A breakout and consolidation below this range will provide a suitable selling opportunity with a move toward 1.1219. The most distant target will be 1.1164, where I plan to take profit. A test of this level would break the bullish market structure.

If EUR/USD moves higher in the second half of the day and there is no strong selling activity at 1.1306, buyers may drive the pair to 1.1342, where moving averages are located, now acting in favor of the bears. I'll sell from that level only after a failed consolidation. I plan to open short positions immediately on a rebound from 1.1379, targeting a 30–35-point correction.

This image is no longer relevant

COT (Commitment of Traders) Report:

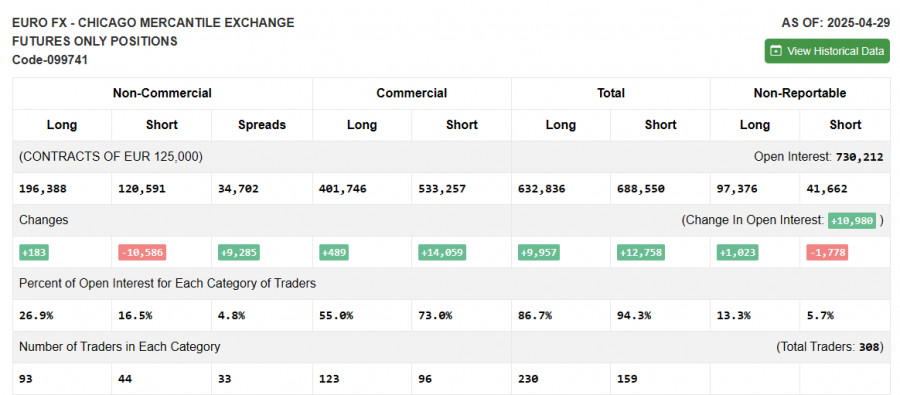
The COT report for April 29 showed a rise in long positions and a decline in shorts. Since the European Central Bank still plans to cut interest rates further, this remains a limiting factor preventing the euro from returning to a bull market. The upcoming Fed meeting is expected to leave borrowing costs unchanged, which plays in favor of the U.S. dollar and will continue to support it. According to the COT report, non-commercial long positions rose by 183 to 196,388, while short positions dropped by 10,586 to 120,591. As a result, the gap between longs and shorts increased by 9,285.

This image is no longer relevant

Indicator Signals:

Moving Averages: Trading is below the 30- and 50-period moving averages, indicating further downside for the pair.

Note: The author's moving average periods and prices are based on the H1 chart and may differ from classical daily MAs on the D1 chart.

Bollinger Bands: In case of a decline, the lower boundary of the indicator around 1.1269 will act as support.

Indicator Descriptions:

  • Moving Average: Identifies the current trend by smoothing out volatility and noise. Period – 50 (yellow), 30 (green).
  • MACD: (Moving Average Convergence/Divergence) Fast EMA – period 12, Slow EMA – period 26, SMA – period 9.
  • Bollinger Bands: Period – 20.
  • Non-commercial traders: Speculators such as individual traders, hedge funds, and large institutions using the futures market for speculative purposes.
  • Non-commercial long positions: The total long open interest held by non-commercial traders.
  • Non-commercial short positions: The total short open interest held by non-commercial traders.
  • Net non-commercial position: The difference between short and long positions held by non-commercial traders.
Summary
Urgency
Analytic
Maxim Magdalinin
Start trade
Gana con los cambios en el valor de las criptomonedas con InstaForex.
Descarga MetaTrader 4 y abre tu primera operación.
  • Grand Choice
    Contest by
    InstaForex
    InstaForex always strives to help you
    fulfill your biggest dreams.
    UNIRSE AL CONCURSO

Recommended Stories

Idea de negociación del oro a la baja

Después de una fuerte iniciativa bajista de dos días, el instrumento pasó a una corrección alcista y en este momento está testeando la zona de ruptura bajista, desde la cual

Andrey Shevchenko 11:36 2025-07-18 UTC+2

GBP/USD plan para la sesión europea del 18 de julio. Informes Commitment of Traders COT (análisis de las operaciones de ayer). La libra esterlina se recuperó ligeramente

Ayer se formó solo un punto de entrada al mercado. Veamos el gráfico de 5 minutos y analicemos lo que ocurrió. En mi pronóstico de la mañana, presté atención

Miroslaw Bawulski 07:50 2025-07-18 UTC+2

EUR/USD plan para la sesión europea del 18 de julio. Informes Commitment of Traders COT (análisis de las operaciones de ayer). El euro rebotó desde el mínimo semanal

Ayer se formó solo un punto de entrada al mercado. Veamos el gráfico de 5 minutos y analicemos lo que ocurrió. En mi pronóstico de la mañana, presté atención

Miroslaw Bawulski 07:50 2025-07-18 UTC+2

Cómo operar el par GBP/USD el 18 de julio. Consejos simples y análisis de operaciones para principiantes.

Análisis de operaciones del jueves: El par GBP/USD el jueves también se negoció con una volatilidad mínima. Por extraño que parezca, ayer hubo bastantes datos interesantes tanto para la libra

Paolo Greco 07:50 2025-07-18 UTC+2

Cómo operar el par EUR/USD el 18 de julio. Consejos simples y análisis de operaciones para principiantes.

El par EUR/USD el jueves se negoció prácticamente en flat y con una volatilidad muy baja (alrededor de 50 puntos). Después de la tormenta del miércoles por la noche, provocada

Paolo Greco 07:50 2025-07-18 UTC+2

GBP/USD plan para la sesión europea del 17 de julio. Informes Commitment of Traders COT (análisis de las operaciones de ayer). La libra esterlina tuvo mucha suerte

Ayer se formaron varios puntos de entrada al mercado. Veamos el gráfico de 5 minutos y analicemos lo que ocurrió. En mi pronóstico matutino presté atención al nivel 1.3376

Miroslaw Bawulski 07:19 2025-07-17 UTC+2

EUR/USD plan para la sesión europea del 17 de julio. Informes Commitment of Traders COT (análisis de las operaciones de ayer). La presión sobre el jefe de la Fed de EE. UU. afecta negativamente al dólar

EUR/USD plan para la sesión europea del 17 de julio. Informes Commitment of Traders COT (análisis de las operaciones de ayer). La presión sobre el jefe

Miroslaw Bawulski 07:19 2025-07-17 UTC+2

Cómo operar con el par EUR/USD el 16 de julio. Consejos simples y análisis de operaciones para principiantes.

El par de divisas EUR/USD se desplomó bruscamente el martes en medio del informe sobre la inflación estadounidense. Como se suele decir, nada presagiaba el problema. Durante varios días consecutivos

Paolo Greco 07:54 2025-07-16 UTC+2

GBP/USD plan para la sesión europea del 16 de julio. Informes Commitment of Traders COT (análisis de las operaciones de ayer). Con la libra esterlina todo va mal

Ayer solo se formó un punto de entrada al mercado. Veamos el gráfico de 5 minutos y analicemos qué ocurrió. En mi pronóstico de la mañana presté atención al nivel

Miroslaw Bawulski 07:54 2025-07-16 UTC+2

EUR/USD plan para la sesión europea del 15 de julio. Informes Commitment of Traders COT (análisis de las operaciones de ayer). La inflación en EE.UU. aumentó

Ayer no llegué a ver condiciones adecuadas para entrar al mercado. Veamos el gráfico de 5 minutos y analicemos lo que ocurrió. En mi pronóstico de la mañana, presté atención

Miroslaw Bawulski 07:54 2025-07-16 UTC+2
¿No puede hablar ahora mismo?
Ingrese su pregunta en el chat.
Widget callback
 

Dear visitor,

Your IP address shows that you are currently located in the USA. If you are a resident of the United States, you are prohibited from using the services of InstaFintech Group including online trading, online transfers, deposit/withdrawal of funds, etc.

If you think you are seeing this message by mistake and your location is not the US, kindly proceed to the website. Otherwise, you must leave the website in order to comply with government restrictions.

Why does your IP address show your location as the USA?

  • - you are using a VPN provided by a hosting company based in the United States;
  • - your IP does not have proper WHOIS records;
  • - an error occurred in the WHOIS geolocation database.

Please confirm whether you are a US resident or not by clicking the relevant button below. If you choose the wrong option, being a US resident, you will not be able to open an account with InstaForex anyway.

We are sorry for any inconvenience caused by this message.