signal strength 1 of 5
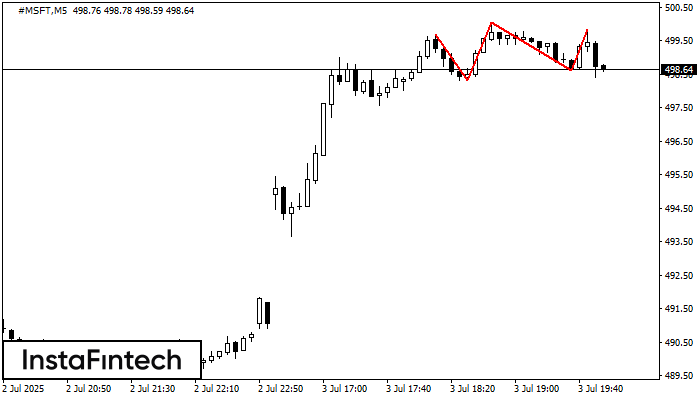
The Triple Top pattern has formed on the chart of the #MSFT M5 trading instrument. It is a reversal pattern featuring the following characteristics: resistance level -15, support level -29, and pattern’s width 135. Forecast If the price breaks through the support level 498.33, it is likely to move further down to 499.91.
The M5 and M15 time frames may have more false entry points.
See Also
- All
- Double Top
- Flag
- Head and Shoulders
- Pennant
- Rectangle
- Triangle
- Triple top
- All
- #AAPL
- #AMZN
- #Bitcoin
- #EBAY
- #FB
- #GOOG
- #INTC
- #KO
- #MA
- #MCD
- #MSFT
- #NTDOY
- #PEP
- #TSLA
- #TWTR
- AUDCAD
- AUDCHF
- AUDJPY
- AUDUSD
- EURCAD
- EURCHF
- EURGBP
- EURJPY
- EURNZD
- EURRUB
- EURUSD
- GBPAUD
- GBPCHF
- GBPJPY
- GBPUSD
- GOLD
- NZDCAD
- NZDCHF
- NZDJPY
- NZDUSD
- SILVER
- USDCAD
- USDCHF
- USDJPY
- USDRUB
- All
- M5
- M15
- M30
- H1
- D1
- All
- Buy
- Sale
- All
- 1
- 2
- 3
- 4
- 5
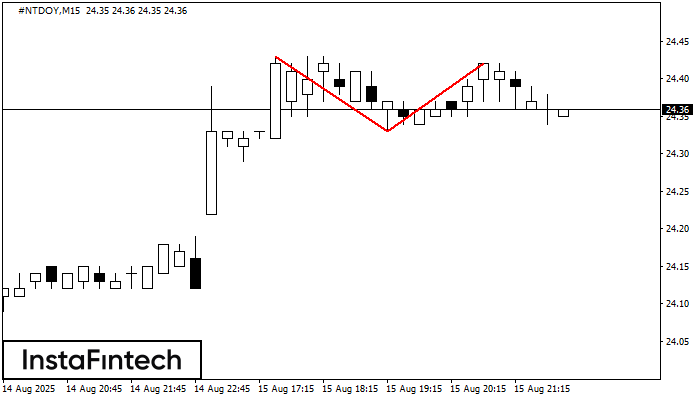
On the chart of #NTDOY M15 the Double Top reversal pattern has been formed. Characteristics: the upper boundary 24.42; the lower boundary 24.33; the width of the pattern 9 points
The M5 and M15 time frames may have more false entry points.
Open chart in a new window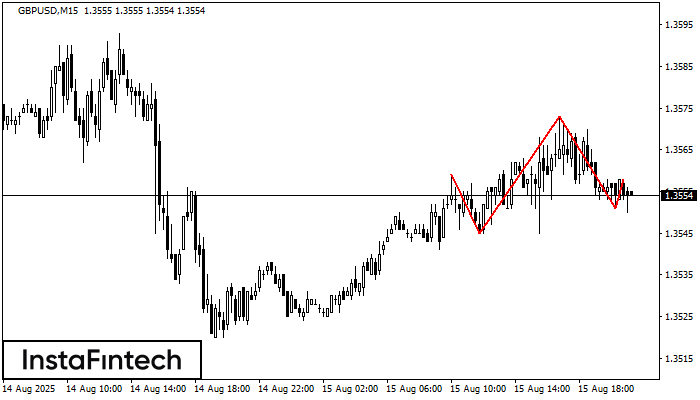
The GBPUSD M15 formed the Head and Shoulders pattern with the following features: The Head’s top is at 1.3573, the Neckline and the upward angle are at 1.3545/1.3551. The formation
The M5 and M15 time frames may have more false entry points.
Open chart in a new window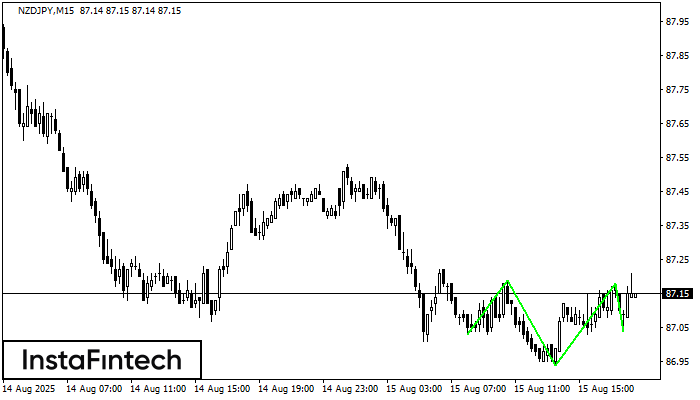
According to M15, NZDJPY is shaping the technical pattern – the Inverse Head and Shoulder. In case the Neckline 87.19/87.18 is broken out, the instrument is likely to move toward
The M5 and M15 time frames may have more false entry points.
Open chart in a new window