empty
04.07.2025 10:53 AM
EUR/USD. July 4th. Bears continue to retreat from the market

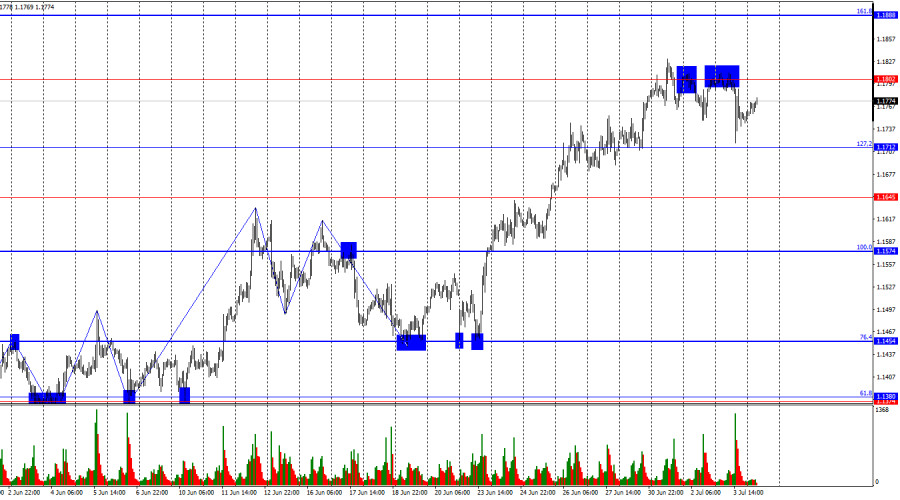
On Thursday, the EUR/USD pair rebounded once again from the 1.1802 level and declined almost to the 127.2% Fibonacci retracement level at 1.1712. As of Friday morning, the pair is in the process of returning to the 1.1802 level. Another rebound from this level may signal a reversal in favor of the U.S. dollar and a potential decline toward 1.1712. A consolidation above 1.1802 would increase the likelihood of further growth toward the next Fibonacci retracement level at 1.1888.

This image is no longer relevant

On the hourly chart, the wave structure remains simple and clear. The most recent completed downward wave broke the low of the previous wave, while the last upward wave surpassed the previous high. Thus, the trend currently remains bullish. The lack of real progress in U.S. trade negotiations and the low likelihood of trade deals being reached with most countries continue to discourage bearish sentiment.

Thursday's news background was strong and, importantly, favorable for bears—something rare in recent months. However, all three key U.S. economic reports turned out stronger than traders had expected. I won't even consider the PMI indices for the Eurozone and Germany, as they had no impact on market sentiment. Let's return to the U.S. statistics. Traders had expected the unemployment rate to rise to 4.3%, but it actually declined to 4.1%. The number of new nonfarm jobs in June totaled 147,000, exceeding the forecast of 100,000–110,000, while May's figure was revised up from 139,000 to 144,000. Even the ISM Services PMI exceeded expectations—50.8 versus the projected 50.5. Thus, bears had a full carte blanche yesterday, which they failed to use—largely because numerous factors related to Donald Trump's policies continue to weigh on the U.S. currency.

This image is no longer relevant

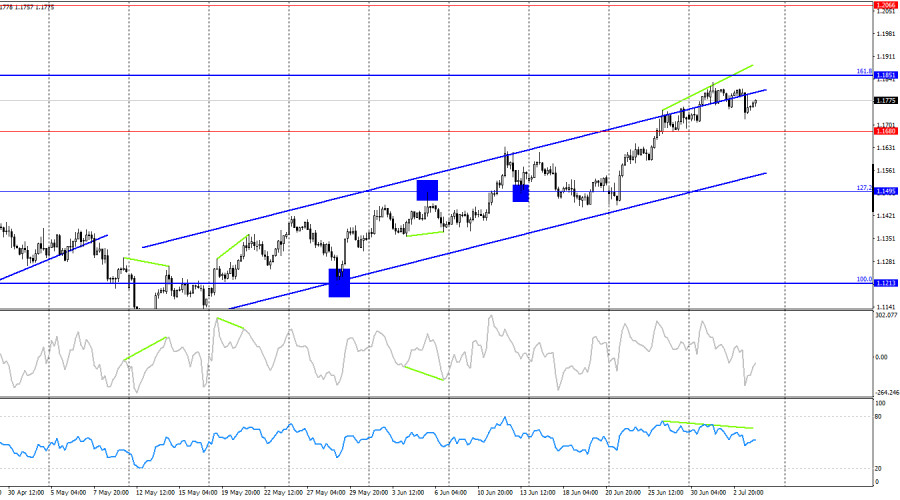
On the 4-hour chart, the pair consolidated above the 1.1680 level and continues to rise toward the next Fibonacci retracement level of 161.8% at 1.1851. A rebound from the 1.1851 level would favor the U.S. dollar and signal a possible decline within the upward trend channel. A close above 1.1851 would increase the probability of continued growth toward the next resistance level at 1.2066. The RSI indicator is showing signs of a potential bearish divergence.

Commitments of Traders (COT) Report:

This image is no longer relevant

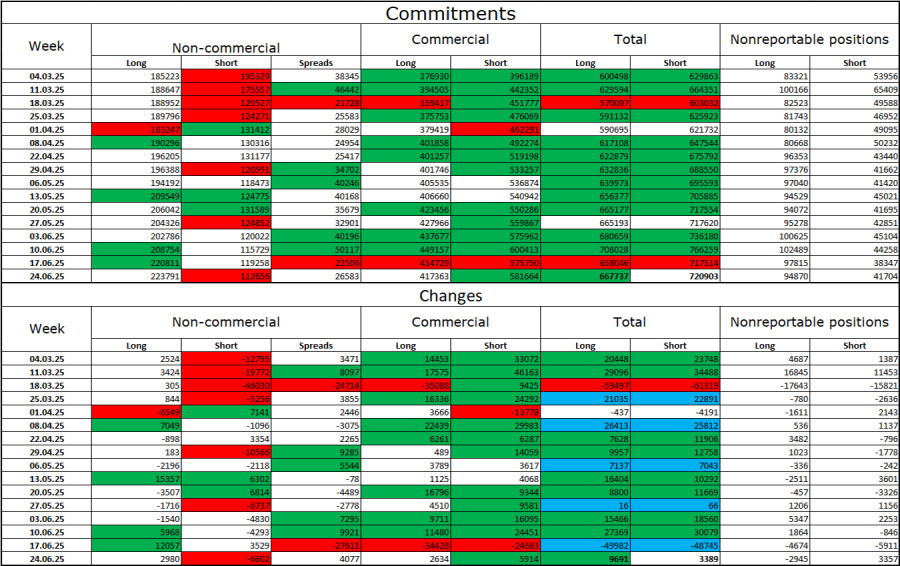
During the latest reporting week, professional traders opened 2,980 long positions and closed 6,602 short positions. The sentiment of the "Non-commercial" group remains bullish—largely due to Donald Trump—and continues to strengthen. The total number of long positions held by speculators now stands at 224,000, while short positions total 112,000, with the gap steadily widening. In other words, demand for the euro persists, while the dollar remains under pressure.

For twenty-one consecutive weeks, large players have been cutting short positions and increasing longs. Although the ECB–Fed monetary policy gap is still significant, Donald Trump's political decisions are viewed by traders as a more influential factor—potentially causing a U.S. economic recession and other long-term structural issues for America.

News calendar for the U.S. and Eurozone:

Eurozone – Speech by ECB President Christine Lagarde (07:30 UTC).

On July 4, the economic calendar contains only one notable entry. The influence of news flow on market sentiment may be very limited today, especially as the U.S. celebrates Independence Day.

EUR/USD forecast and trader tips:

I would consider selling the pair today if it rebounds from the 1.1802 level on the hourly chart, with a target of 1.1712. I previously recommended buying at the rebound from 1.1454, targeting 1.1574, 1.1645, 1.1712, and 1.1802—all of which have been reached. New long positions could be considered upon a close above 1.1802, targeting 1.1888.

The Fibonacci levels are plotted from 1.1574 to 1.1066 on the hourly chart and from 1.1214 to 1.0179 on the 4-hour chart.

Samir Klishi,
انسٹافاریکس کا تجزیاتی ماہر
© 2007-2025
Summary
Urgency
Analytic
Grigory Sokolov
Start trade
انسٹافاریکس کے ساتھ کرپٹو کرنسی کی معاملاتی تبدیلیوں سے کمائیں۔
میٹا ٹریڈر 4 ڈاؤن لوڈ کریں اور اپنی پہلی ٹریڈ کھولیں۔
  • چانسی ڈیپازٹ
    اپنے اکاؤنٹ میں 3000 ڈالر جمع کروائیں اور حاصل کریں$3000 مزید!
    ہم ستمبر قرعہ اندازی کرتے ہیں $3000چانسی ڈیپازٹ نامی مقابلہ کے تحت
    اپنے اکاؤنٹ میں 3000 ڈالر جمع کروانے پر موقع حاصل کریں - اس شرط پر پورا اُترتے ہوئے اس مقابلہ میں شرکت کریں
    مقابلہ میں شامل ہوں

تجویز کردہ مضامین

یو ایس ڈی / جے پی وائے : تجزیہ اور پیشن گوئی

تکنیکی نقطہ نظر سے، 147.00 کے راؤنڈ لیول کا کل کا وقفہ اور اس کے نیچے استحکام ریچھوں کے لیے ایک تازہ محرک بن گیا۔ مزید برآں، روزانہ چارٹ

Irina Yanina 16:49 2025-09-17 UTC+2

یورو / یو ایس ڈی کا تجزیہ برائے 16 ستمبر 2025

پیر کو، یورو / یو ایس ڈی کے جوڑے نے اپنی اوپر کی طرف حرکت جاری رکھی، جیسا کہ میری توقع تھی، اور منگل کی صبح ہدف تک پہنچ

Samir Klishi 16:05 2025-09-16 UTC+2

سونا کیا سونے کی قیمتوں میں اضافے کا امکان ہے؟

حال ہی میں، سونے کی قیمت کو دو اہم عوامل کی بنیاد پر کافی حمایت حاصل ہوئی ہے۔ سب سے پہلے، فیڈرل ریزرو کی جانب سے شرح سود میں متوقع

Pati Gani 17:15 2025-09-10 UTC+2

یورو / یو ایس ڈی 10 ستمبر 2025 کو اشارے کا تجزیہ

منگل کو، جوڑا نیچے کی طرف چلا گیا، 1.1706 (پتلی سرخ لکیر) پر 5-پیریڈ ای ایم اے کا تجربہ کیا، اور روزانہ کینڈل کو 1.1707 پر بند کر دیا۔ آج،

Stefan Doll 17:14 2025-09-10 UTC+2

ستمبر 10 2025 کو جی بی پی / یو ایس ڈی کی پیشن گوئی

فی گھنٹہ چارٹ پر، منگل کو جی بی پی / یو ایس ڈی جوڑا 100.0% فیبوناچی لیول – 1.3587 سے ریباؤنڈ ہوا، جو امریکی کرنسی کے حق میں ہو گیا،

Samir Klishi 16:25 2025-09-10 UTC+2

ستمبر 10 2025 کو یورو / یو ایس ڈی کی پیشن گوئی

منگل کو، یورو / یو ایس ڈی پئیر امریکی ڈالر کے حق میں ہو گیا، جو 1.1789 کی سطح سے صرف 8 پوائنٹس سے کم ہو گیا۔ اس کے بعد،

Samir Klishi 16:07 2025-09-10 UTC+2

ستمبر 08 کے لیے یورو / یو ایس ڈی کے تجارتی سگنل 1.1720 سے اوپر خریدیں (200 ای ایم اے - 8/8 مرے)

اگر یورو 1.1720 سے اوپر ٹوٹ جاتا ہے، تو ہم توقع کر سکتے ہیں کہ تیزی کا چکر دوبارہ شروع ہو جائے گا اور یورو / یو ایس ڈی ممکنہ

Dimitrios Zappas 17:12 2025-09-08 UTC+2

جی بی پی / یو ایس ڈی کی پیشن گوئی برائے 04 ستمبر 2025

فی گھنٹہ چارٹ پر، جی بی پی / یو ایس ڈی بدھ کے روز 1.3357–1.3364 کے سپورٹ زون سے واپس آ گیا، پاؤنڈ کے حق میں پلٹ گیا، اور 1.3416–1.3425

Samir Klishi 16:25 2025-09-04 UTC+2

ستمبر 04 2025 کو یورو / یو ایس ڈی کے لیے پیشن گوئی

بدھ کو، یورو / یو ایس ڈی نے افقی چینل کے اندر یورو کے حق میں ایک اور الٹ پلٹ کیا اور 1.1637–1.1645 زون کے اوپر مضبوط ہو گیا۔

Samir Klishi 15:31 2025-09-04 UTC+2

جی بی پی / یو ایس ڈی کی پیشن گوئی برائے 02 ستمبر 2025

فی گھنٹہ کے چارٹ پر، جی بی پی / یو ایس ڈی نے پیر کو 1.3586 پر 100.0% ریٹریسمنٹ لیول کی طرف اپنا اوپر کی طرف بڑھنا جاری رکھا، لیکن

Samir Klishi 16:48 2025-09-02 UTC+2
ابھی فوری بات نہیں کرسکتے ؟
اپنا سوال پوچھیں بذریعہ چیٹ.
Widget callback
 

Dear visitor,

Your IP address shows that you are currently located in the USA. If you are a resident of the United States, you are prohibited from using the services of InstaFintech Group including online trading, online transfers, deposit/withdrawal of funds, etc.

If you think you are seeing this message by mistake and your location is not the US, kindly proceed to the website. Otherwise, you must leave the website in order to comply with government restrictions.

Why does your IP address show your location as the USA?

  • - you are using a VPN provided by a hosting company based in the United States;
  • - your IP does not have proper WHOIS records;
  • - an error occurred in the WHOIS geolocation database.

Please confirm whether you are a US resident or not by clicking the relevant button below. If you choose the wrong option, being a US resident, you will not be able to open an account with InstaForex anyway.

We are sorry for any inconvenience caused by this message.