empty
14.04.2023 12:52 AM
Technical analysis of GBP/USD for April 13, 2023

This image is no longer relevant

Overview :

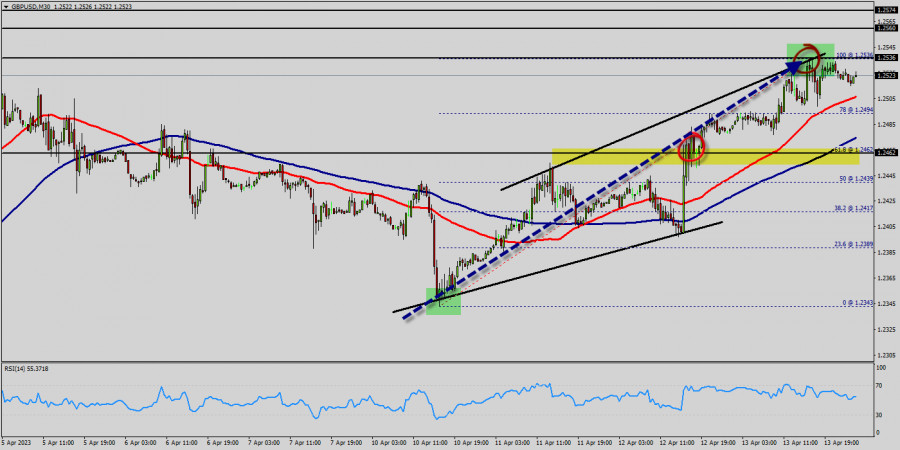
The GBPUSD pair traded with strong positivity yesterday to return to the bullish channel that appears on the chart, to head towards achieving expected additional gains in the upcoming sessions, targeting visiting 1.2522 level mainly. Therefore, we expect to witness more bullish bias in the upcoming sessions, noting that breaking 1.2462 and holding above it will stop the positive scenario and push the price to decline again.

The expected trading range for today is between 1.2462 support and 1.2560 resistance. The GBP/USD pair is going to continue to rise from the level of 1.2462 in the long term.

It should be noted that the support is established at the level of 1.2462 which represents the 61.8% Fibonacci retracement level on the M30 chart. The price is likely to form a double bottom in the same time frame. Accordingly, the GBP/USD pair is showing signs of strength following a breakout of the highest level of 1.2462.

So, buy above the level of 1.2462 with the first target at 1.2536 in order to test the daily resistance 1; and further to 1.2560.

Also, it might be noted that the level of 1.2560 is a good place to take profit because it will form a double top. The price is in a bullish channel now. In the Forex market, liquidity pertains to a currency pair's ability to be bought and sold at the current market price. Additionally, liquidity refers to market volatility and dynamics. Because the Forex market is colossal, it is also extremely liquid. Moreover, if a currency pair has high level of liquidity, it will be easier to trade.

On the other hand, in case a reversal takes place and the GBP/USD pair breaks through the support level of 1.2462, a further decline to 1.2343 can occur which would indicate a bearish market.

Trading recommendations :

The trend is still bullish as long as the price of 1.2463 is not broken. Thereupon, it would be wise to buy above the price of at 1.2463 with the primary target at 1.2536. Then, the GBP/USD pair will continue towards the second target at 1.2560.

In technical analysis: history usually repeats itself at certain level. So it will be of the wisdom to use historic rates to determine future prices. The technical analysis based only on the technical market data (quotes) with the help of various technical indicators. Moreover, in this book we will be touching on a variety of new techniques for applying numerical strategies, equations, formulas and probabilities. Additionally, we will be shared some of classical analysis such as breakout strategy and trend indicators. Alternative scenario : The breakdown of 1.2463 will allow the pair to go further down to the prices of 1.2403 and 1.2343.

Summary
Urgency
Analytic
Mourad El Keddani
Start trade
انسٹافاریکس کے ساتھ کرپٹو کرنسی کی معاملاتی تبدیلیوں سے کمائیں۔
میٹا ٹریڈر 4 ڈاؤن لوڈ کریں اور اپنی پہلی ٹریڈ کھولیں۔
  • Grand Choice
    Contest by
    InstaForex
    InstaForex always strives to help you
    fulfill your biggest dreams.
    مقابلہ میں شامل ہوں

تجویز کردہ مضامین

سونا : تجزیہ اور پیشن گوئی

یہ کہ $3358 کی سطح سے اوپر کا بریک آؤٹ، جہاں 4 گھنٹے کے چارٹ پر 100 پیریڈ سادہ موونگ ایوریج (ایس ایم اے) واقع ہے، اس ہفتے کے شروع

Irina Yanina 17:24 2025-08-14 UTC+2

جی بی پی / یو ایس ڈی 14 اگست 2025 کو اشارے کا تجزیہ

بدھ کو، جوڑے نے، اوپر کی طرف بڑھتے ہوئے، 1.3587 (ریڈ ڈیشڈ لائن) پر اوپری فریکٹل کا تجربہ کیا اور پھر 1.3571 پر یومیہ موم بتی بند کرتے ہوئے تھوڑا

Stefan Doll 17:14 2025-08-14 UTC+2

ایکس اے یو / یو ایس ڈی : تجزیہ اور پیشن گوئی

تکنیکی نقطہ نظر سے، سونا 4 گھنٹے کے چارٹ پر 200 مدت کے سادہ موونگ ایوریج (ایس ایم اے) سے اوپر رکھنے کا انتظام کر رہا ہے، جو ایک کلیدی

Irina Yanina 19:46 2025-08-12 UTC+2

اگست 12-15 2025 کے لیے یورو / یو ایس ڈی کے لیے تجارتی سگنل: 1.1647 سے نیچے فروخت کریں (200 ای ایم اے - 7/8 مرے)

یورو 1.1618 کے ارد گرد ٹریڈ کر رہا ہے، 200 ای ایم اے کے اوپر اور 6/8 مرے سے اوپر، پچھلے دن کے کچھ نقصانات کو ٹھیک

Dimitrios Zappas 16:22 2025-08-12 UTC+2

12-15 اگست 2025 کے لیے سونے (ایکس اے یو / یو ایس ڈی) کے لیے تجارتی اشارہ: $3,341 سے اوپر خریدیں یا $3,335 سے نیچے فروخت کریں (21 ایس ایم اے - 200 ای ایم اے)

اگر سونا 3,340 سے نیچے آتا ہے تو آؤٹ لک منفی ہو سکتا ہے۔ اس کے بعد یہ اپنی نیچے کی طرف حرکت دوبارہ شروع کر سکتا ہے،

Dimitrios Zappas 15:42 2025-08-12 UTC+2

اگست 11 2025 کو جی بی پی / یو ایس ڈی کی پیشن گوئی

گھنٹہ وار چارٹ پر، جمعہ کے روز جی بی پی / یو ایس ڈی نے 1.3425 کی سطح سے دو ریباؤنڈز بنائے، اور پیر کو 1.3470 پر 76.4% ریٹریسمنٹ لیول

Samir Klishi 19:29 2025-08-11 UTC+2

اگست 11 2025 کو یورو / یو ایس ڈی کی پیشن گوئی

جمعہ کو، یورو / یو ایس ڈی نے 1.1637–1.1645 سپورٹ زون سے دو ریباؤنڈ کیے اور یورو کے حق میں ہو گئے۔ اس کا مطلب ہے کہ اوپر کی حرکت

Samir Klishi 19:24 2025-08-11 UTC+2

اگست 11-15 2025 کے لیے سونے (ایکس اے یو / یو ایس ڈی) کے لیے تجارتی اشارہ: $3,380 سے نیچے فروخت کریں یا 3,341 ریباؤنڈ ہونے پر خریدیں (21 ایس ایم اے - 7/8 مرے)

ایگل انڈیکیٹر ایک منفی اشارہ دکھا رہا ہے، لہذا اگر ہم خرید رہے ہیں تو ہمیں بہت محتاط رہنا چاہیے، کیونکہ آنے والے گھنٹوں اور پورے ہفتے میں مندی

Dimitrios Zappas 18:56 2025-08-11 UTC+2

اگست 11-15 2025 کے لیے یورو / یو ایس ڈی کے لیے تجارتی سگنل: 1.1650 سے نیچے فروخت کریں (200 ای ایم اے - 7/8 مرے)

اگر آنے والے دنوں میں یورو 1.1650 سے نیچے مضبوط ہو جاتا ہے، تو کسی بھی تکنیکی ریباؤنڈ کو فروخت جاری رکھنے کے موقع کے طور پر دیکھا جائے گا۔

Dimitrios Zappas 18:53 2025-08-11 UTC+2

اگست 8-11 2025 کے لیے بٹ کوائن کے لیے تجارتی سگنل: $117,800 سے نیچے فروخت کریں (200 ای ایم اے - 21 ایس ایم اے)

یہ کہ $115,000 سے نیچے کی کمی بیئرش سائیکل کو بحال کر سکتی ہے۔ لہذا، ہم توقع کرتے ہیں کہ بٹ کوائن 112,500 پر مرے کے 4/8 تک پہنچ جائے

Dimitrios Zappas 20:08 2025-08-10 UTC+2
ابھی فوری بات نہیں کرسکتے ؟
اپنا سوال پوچھیں بذریعہ چیٹ.
Widget callback
 

Dear visitor,

Your IP address shows that you are currently located in the USA. If you are a resident of the United States, you are prohibited from using the services of InstaFintech Group including online trading, online transfers, deposit/withdrawal of funds, etc.

If you think you are seeing this message by mistake and your location is not the US, kindly proceed to the website. Otherwise, you must leave the website in order to comply with government restrictions.

Why does your IP address show your location as the USA?

  • - you are using a VPN provided by a hosting company based in the United States;
  • - your IP does not have proper WHOIS records;
  • - an error occurred in the WHOIS geolocation database.

Please confirm whether you are a US resident or not by clicking the relevant button below. If you choose the wrong option, being a US resident, you will not be able to open an account with InstaForex anyway.

We are sorry for any inconvenience caused by this message.