empty
21.03.2023 03:41 PM
Trading Signal for GOLD (XAU/USD) for March 21 - 22, 2023: sell below $1,968 or buy if rebound $1,960 (7/8 Murray - 21 SMA )

This image is no longer relevant

XAU/USD retreats from its annual high reached on March 20 at 2,009.66. The global banking jitters have passed for now and US Treasury yields have been bouncing, erasing Gold's strength.

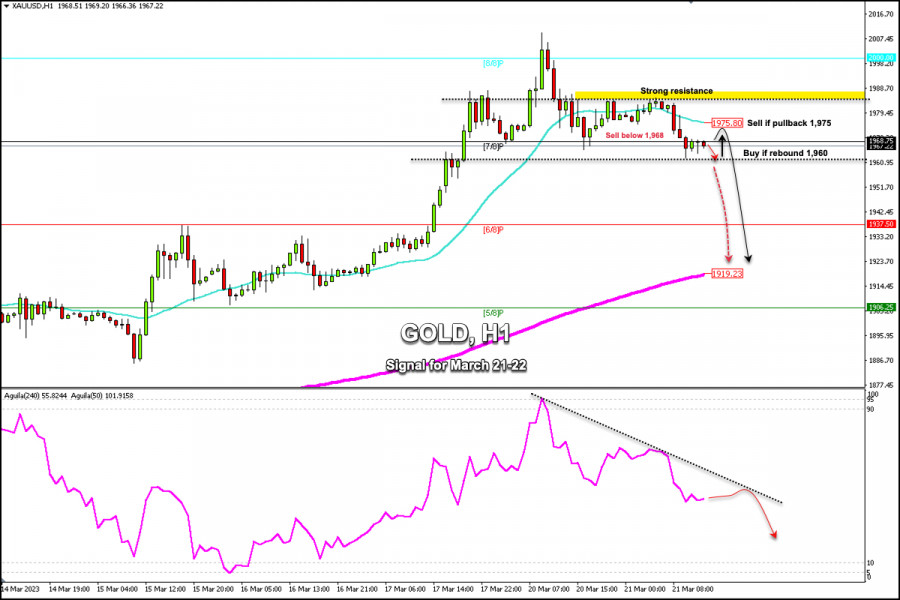
According to the 1-hour chart, gold is trading below the 21 SMA located at 1,975 and below the strong resistance of 1,986. We can clearly see that the asset is under strong bearish pressure but it could find a bottom around 1,960. At this level in the 4-hour chart, we can see the 21 SMA which will act as strong support and gold could then resume the bullish cycle.

In case gold breaks out sharply and consolidates below 1,960, we would expect a bearish acceleration and the instrument could reach the 6/8 Murray at 1,937 and could ultimately reach the 200 EMA located at 1,919.

On the contrary, if gold remains above 1,960, it could give us a signal to buy with targets at 1,975 (21 SMA) and 1,986 (weekly_resistance).

Since its high reached in the last hours, gold has made a correction of almost $40 as part of profit taking. The instrument is likely to see a technical rebound in the coming hours and then continue with a short-term downtrend.

Our trading plan for the next few hours is to sell below 7/8 Murray located at 1,968, with targets at 1,960. Around this level, we can expect a technical bounce to buy with targets at 1,975. The Eagle indicator from 20 March is giving a negative signal. Hence, as long as the metal trades below 1,985, any technical bounce will be seen as a signal to sell.

Dimitrios Zappas,
انسٹافاریکس کا تجزیاتی ماہر
© 2007-2025
Summary
Urgency
Analytic
Dimitrios Zappas
Start trade
انسٹافاریکس کے ساتھ کرپٹو کرنسی کی معاملاتی تبدیلیوں سے کمائیں۔
میٹا ٹریڈر 4 ڈاؤن لوڈ کریں اور اپنی پہلی ٹریڈ کھولیں۔
  • Grand Choice
    Contest by
    InstaForex
    InstaForex always strives to help you
    fulfill your biggest dreams.
    مقابلہ میں شامل ہوں

تجویز کردہ مضامین

یو ایس ڈی / جے پی وائے : تجزیہ اور پیشن گوئی

یو ایس ڈی / جے پی وائے جوڑا تین ہفتے کی بلند ترین سطح کے قریب استحکام کے مرحلے میں ہے، جسے امریکی ڈالر کی مضبوطی اور مخلوط مارکیٹ سگنلز

Irina Yanina 14:47 2025-07-14 UTC+2

جی بی پی / یو ایس ڈی کی پیشن گوئی برائے 11 جولائی 2026

گھنٹہ وار چارٹ پر، جمعرات کو جی بی پی / یو ایس ڈی پئیر 1.3611–1.3633 کے مزاحمتی زون سے واپس آیا اور 1.3527 پر 127.2% فیبوناچی سطح کی طرف اپنی

Samir Klishi 20:10 2025-07-11 UTC+2

یورو / یو ایس ڈی کی پیشن گوئی برائے 11 جولائی 2025

جمعرات کو، یورو / یو ایس ڈی پئیر نے 1.1645 کی سطح کی طرف اپنی کمی جاری رکھی، جبکہ 1.1712 پر 127.2% فیبوناچی تصحیحی سطح کو تاجروں

Samir Klishi 19:59 2025-07-11 UTC+2

جولائی 10 2025 کو یورو / یو ایس ڈی کے لیے پیشن گوئی

بدھ کے روز، یورو / یو ایس ڈی پئیر ایک ایسے راستے کے ساتھ آگے بڑھتا رہا جو صرف خود کو معلوم تھا۔ 1.1712 پر 127.2% فیبوناچی تصحیح

Samir Klishi 14:23 2025-07-10 UTC+2

جی بی پی / جے پی وائے تجزیہ، پیشن گوئی، اور موجودہ مارکیٹ کی صورتحال

جمعرات کو، جی بی پی / جے پی وائے جوڑا دوبارہ اوپر کی رفتار حاصل کر رہا ہے اور مزید ترقی کے لیے تیاری ظاہر کرتا ہے۔ ایک چڑھتے ہوئے

Irina Yanina 14:14 2025-07-10 UTC+2

این ذیڈ ڈی / یو ایس ڈی ۔ تجزیہ، پیشن گوئی، اور موجودہ مارکیٹ کی صورتحال

این ذیڈ ڈی / یو ایس ڈی جوڑا فی الحال 0.6000 کی نفسیاتی سطح سے اوپر ٹریڈ کر رہا ہے۔ تاہم، یہ وسیع البنیاد امریکی ڈالر کی طاقت کے درمیان

Irina Yanina 14:46 2025-07-09 UTC+2

اے یو ڈی / جے پی وائے : تجزیہ اور جائزہ

منگل کو، اے یو ڈی / جے پی وائے جوڑے نے پراعتماد ترقی دکھائی، جو کہ ریزرو بینک آف آسٹریلیا (آر بی اے) کے سود کی شرح کو غیر تبدیل

Irina Yanina 15:39 2025-07-08 UTC+2

ایکس اے یو / یو ایس ڈی : تجزیہ، پیشن گوئی، اور موجودہ مارکیٹ کی صورتحال

سونا آج انٹرا ڈے ٹون میں مندی کو برقرار رکھے ہوئے ہے۔ روزانہ چارٹ پر آسکیلیٹر ابھی منفی رفتار دکھانا شروع کر رہے ہیں، جو دھات کی قیمت میں مزید

Irina Yanina 14:25 2025-07-07 UTC+2

جی بی پی / یو ایس ڈی : سٹرلنگ سپورٹ حاصل کرنا بند کر سکتا ہے۔

جیسا کہ پہلے متعدد مواقع پر ذکر کیا گیا ہے، غیر ملکی کرنسی (فاریکس) مارکیٹ میں امریکی ڈالر کے مقابلے میں تجارت کی جانے والی بڑی کرنسیوں کی طاقت

Pati Gani 15:00 2025-07-03 UTC+2

یو ایس ڈی / جے پی وائے ۔ تجزیہ، پیشن گوئی، اور موجودہ مارکیٹ کی صورتحال

یہ کہ 4 گھنٹے کے چارٹ پر موجود منفی آسکیلیٹر اس بات کی نشاندہی کرتے ہیں کہ مزید اوپر کی حرکت کو فروخت کے موقع کے طور پر دیکھا

Irina Yanina 19:37 2025-07-02 UTC+2
ابھی فوری بات نہیں کرسکتے ؟
اپنا سوال پوچھیں بذریعہ چیٹ.
Widget callback
 

Dear visitor,

Your IP address shows that you are currently located in the USA. If you are a resident of the United States, you are prohibited from using the services of InstaFintech Group including online trading, online transfers, deposit/withdrawal of funds, etc.

If you think you are seeing this message by mistake and your location is not the US, kindly proceed to the website. Otherwise, you must leave the website in order to comply with government restrictions.

Why does your IP address show your location as the USA?

  • - you are using a VPN provided by a hosting company based in the United States;
  • - your IP does not have proper WHOIS records;
  • - an error occurred in the WHOIS geolocation database.

Please confirm whether you are a US resident or not by clicking the relevant button below. If you choose the wrong option, being a US resident, you will not be able to open an account with InstaForex anyway.

We are sorry for any inconvenience caused by this message.