 Stay
Stay 
Trading Conditions
Products
Tools


The GBP/USD pair also traded lower on Monday, although the decline started much later than it did for the euro. This appears to be a classic case where the British pound pulled the euro down. Traders needed some time to decide to sell the pound as well, but ultimately, the British currency also posted a logical decline, even though the trade agreement between the U.S. and the EU has nothing to do with the UK. However, due to the high correlation between the euro and the pound, these moves were seen on Monday.
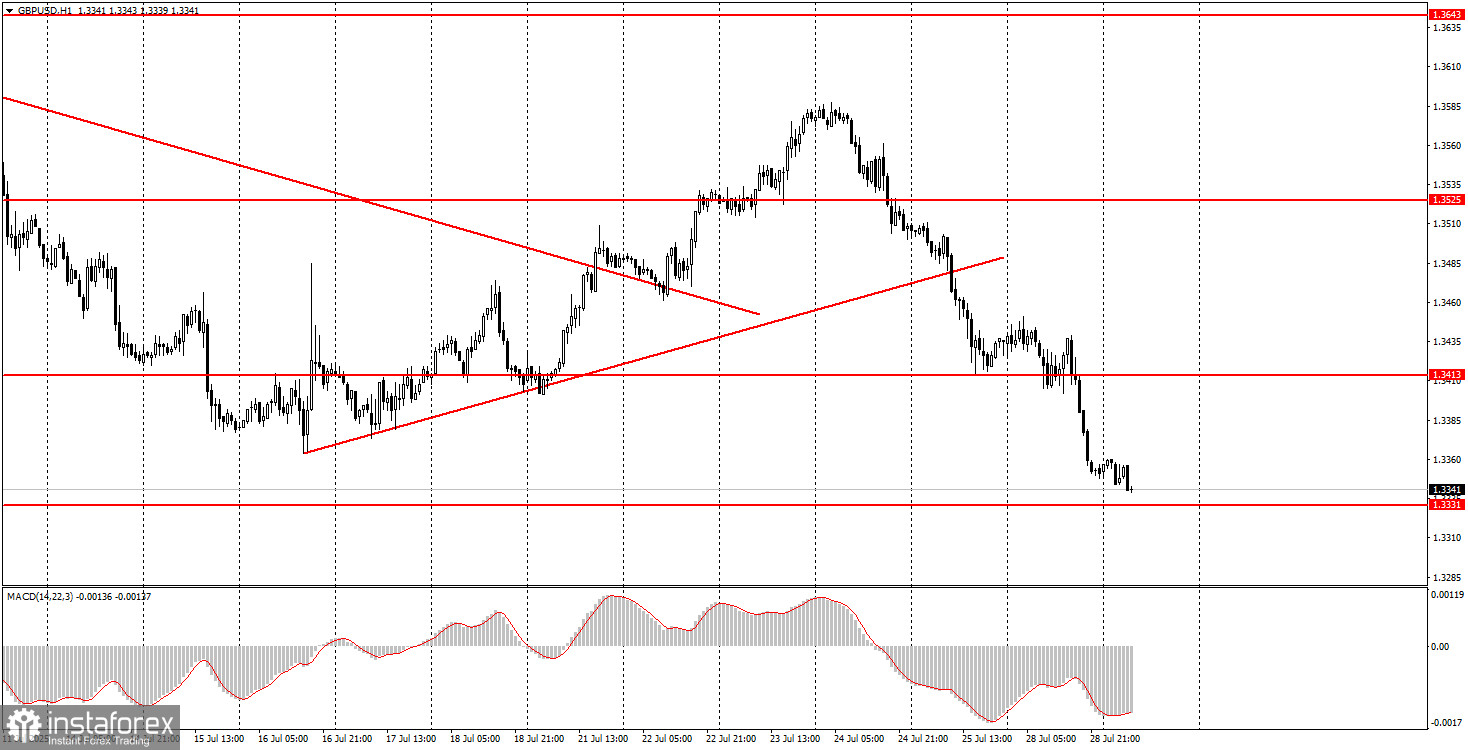
As for macroeconomic and fundamental events related to the pound, there was nothing noteworthy on Monday. From a technical standpoint, the pair began a new leg of a downward correction on higher timeframes, and a new local downtrend on the lower ones. The level of 1.3331 may act as support and attempt to halt further decline today. The outlook for the U.S. dollar improved on Monday, but remains relatively weak and mixed.
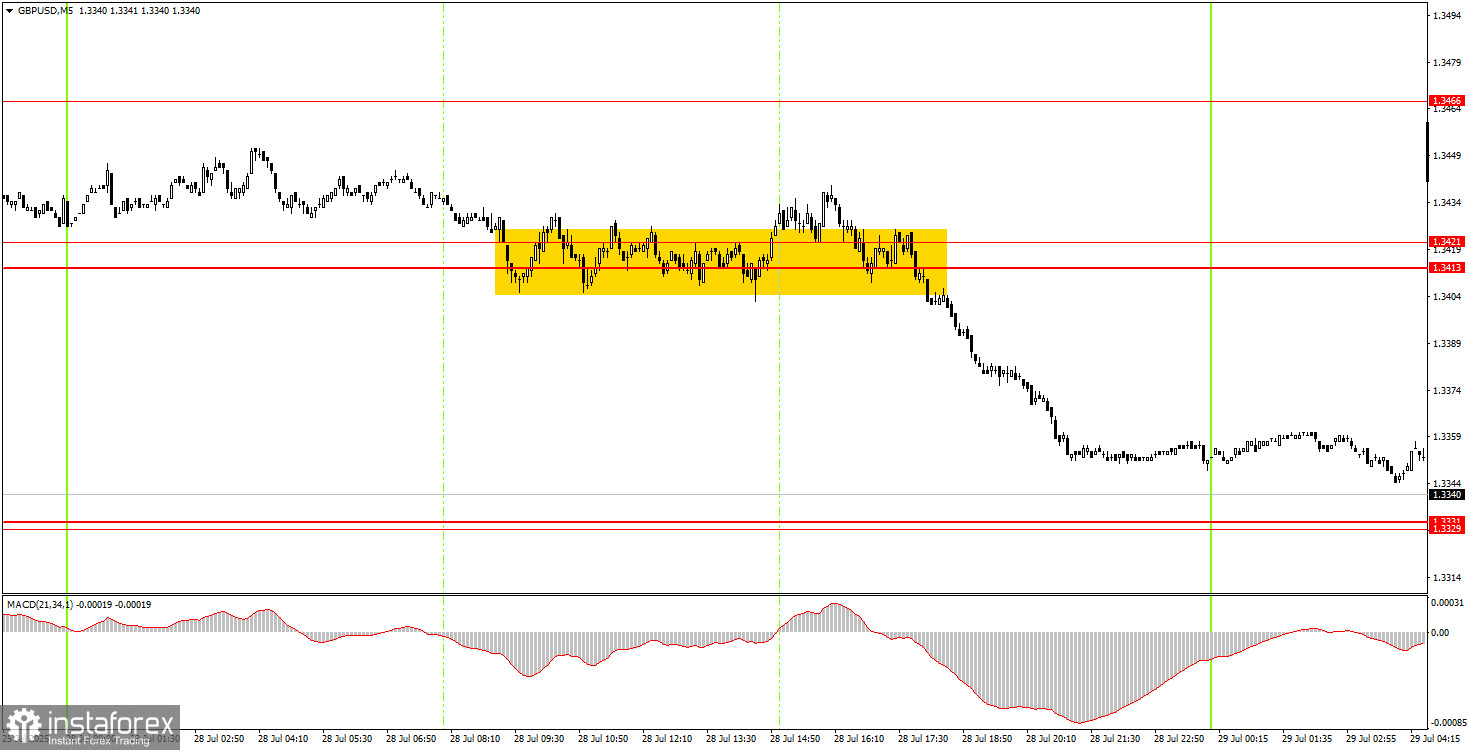
In the 5-minute time frame, mostly false trading signals were formed on Monday, as the price spent most of the day in a flat range. During the U.S. session, the price eventually began a strong movement, but by that time, numerous false signals had already formed around the 1.3413–1.3421 area.
On the hourly time frame, the GBP/USD pair continues its downward technical correction. The pound declined for two consecutive days without any strong reasons, broke through the ascending trendline, and on Monday received actual fundamental support for continued decline. Thus, in the near term, the dollar may continue recovering, and the potential depth of the correction is best determined using the daily chart.
On Tuesday, the GBP/USD pair may rebound slightly from the 1.3331 level, which traders may view as a potential buy signal. A break and consolidation below 1.3331 would support holding or opening short positions. Further decline is quite possible given Monday's developments.
On the 5-minute time frame, current levels to watch for trading are: 1.3203–1.3211, 1.3259, 1.3329–1.3331, 1.3413–1.3421, 1.3466, 1.3518–1.3532, 1.3574–1.3590, 1.3643–1.3652, 1.3682, 1.3763, 1.3814–1.3832.
For Tuesday, no major reports or events are scheduled in the UK, while in the U.S., the JOLTS job openings report will be released. This is the only moderately important event of the day, but the market may continue reacting to the EU–U.S. trade agreement.
Support and Resistance Levels: These are target levels for opening or closing positions and can also serve as points for placing Take Profit orders.
Red Lines: Channels or trendlines indicating the current trend and the preferred direction for trading.
MACD Indicator (14,22,3): A histogram and signal line used as a supplementary source of trading signals.
Important Events and Reports: Found in the economic calendar, these can heavily influence price movements. Exercise caution or exit the market during their release to avoid sharp reversals.
Forex trading beginners should remember that not every trade will be profitable. Developing a clear strategy and practicing proper money management are essential for long-term trading success.
InstaForex analytical reviews will make you fully aware of market trends! Being an InstaForex client, you are provided with a large number of free services for efficient trading.


