signal strength 3 of 5
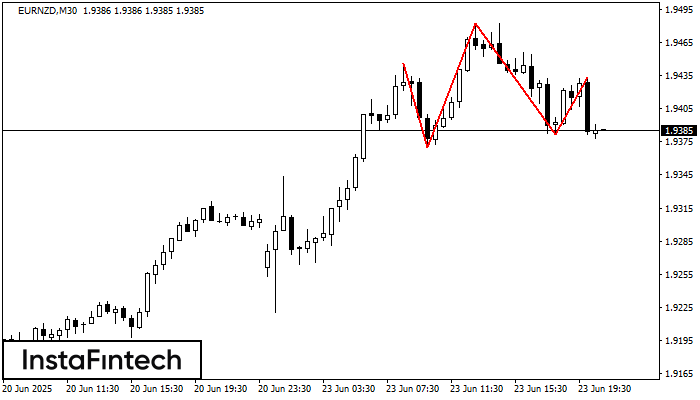
According to the chart of M30, EURNZD formed the Head and Shoulders pattern. The Head’s top is set at 1.9482 while the median line of the Neck is found at 1.9370/1.9382. The formation of the Head and Shoulders pattern evidently signals a reversal of the upward trend. In other words, in case the scenario comes true, the price of EURNZD will go towards 1.9352.
See Also
- All
- Double Top
- Flag
- Head and Shoulders
- Pennant
- Rectangle
- Triangle
- Triple top
- All
- #AAPL
- #AMZN
- #Bitcoin
- #EBAY
- #FB
- #GOOG
- #INTC
- #KO
- #MA
- #MCD
- #MSFT
- #NTDOY
- #PEP
- #TSLA
- #TWTR
- AUDCAD
- AUDCHF
- AUDJPY
- AUDUSD
- EURCAD
- EURCHF
- EURGBP
- EURJPY
- EURNZD
- EURRUB
- EURUSD
- GBPAUD
- GBPCHF
- GBPJPY
- GBPUSD
- GOLD
- NZDCAD
- NZDCHF
- NZDJPY
- NZDUSD
- SILVER
- USDCAD
- USDCHF
- USDJPY
- USDRUB
- All
- M5
- M15
- M30
- H1
- D1
- All
- Buy
- Sale
- All
- 1
- 2
- 3
- 4
- 5
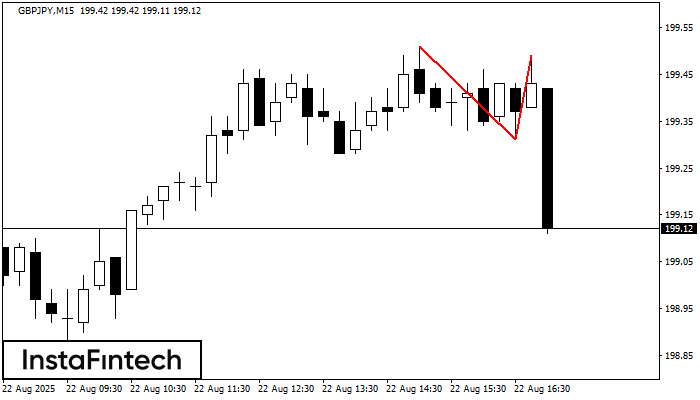
On the chart of GBPJPY M15 the Double Top reversal pattern has been formed. Characteristics: the upper boundary 199.49; the lower boundary 199.31; the width of the pattern 18 points
The M5 and M15 time frames may have more false entry points.
Open chart in a new window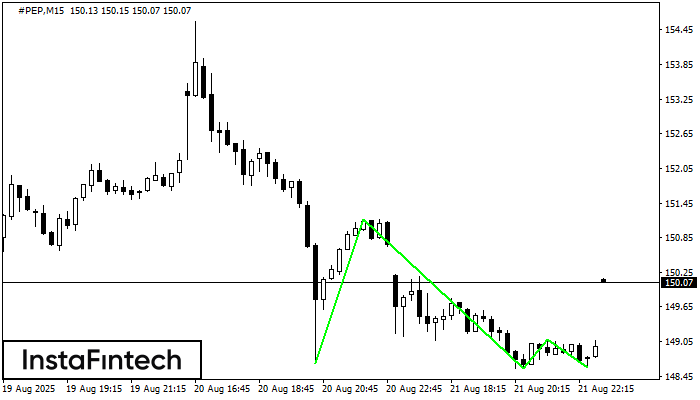
The Triple Bottom pattern has been formed on #PEP M15. It has the following characteristics: resistance level 151.17/149.08; support level 148.67/148.60; the width is 250 points. In the event
The M5 and M15 time frames may have more false entry points.
Open chart in a new window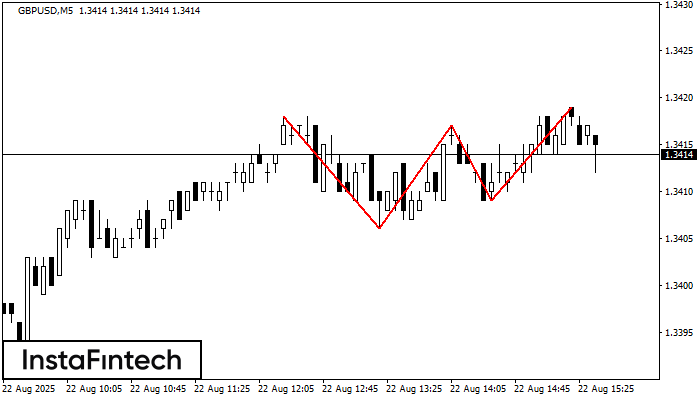
The Triple Top pattern has formed on the chart of the GBPUSD M5 trading instrument. It is a reversal pattern featuring the following characteristics: resistance level -1, support level -3
The M5 and M15 time frames may have more false entry points.
Open chart in a new window