empty
14.07.2025 04:33 AM
Trading Recommendations and Trade Breakdown for GBP/USD on July 14. The British Pound Maintains a Bearish Bias

GBP/USD 5-Minute Analysis

This image is no longer relevant

The GBP/USD currency pair continued its downward movement throughout Friday. We cannot say there were strong reasons for this, but in the morning, the UK released reports on GDP (monthly version) and industrial production. These reports showed relatively weak figures. For example, GDP contracted by 0.1% in May, while the forecast was +0.1%. Industrial production fell by 0.9% against a forecast of 0%. Thus, formally, the decline in the British pound was completely justified. However, we want to draw traders' attention to the fact that the pound has been falling all week, even though the fundamental background did not support the U.S. dollar. Therefore, we continue to believe that a technical corrective move is still underway.

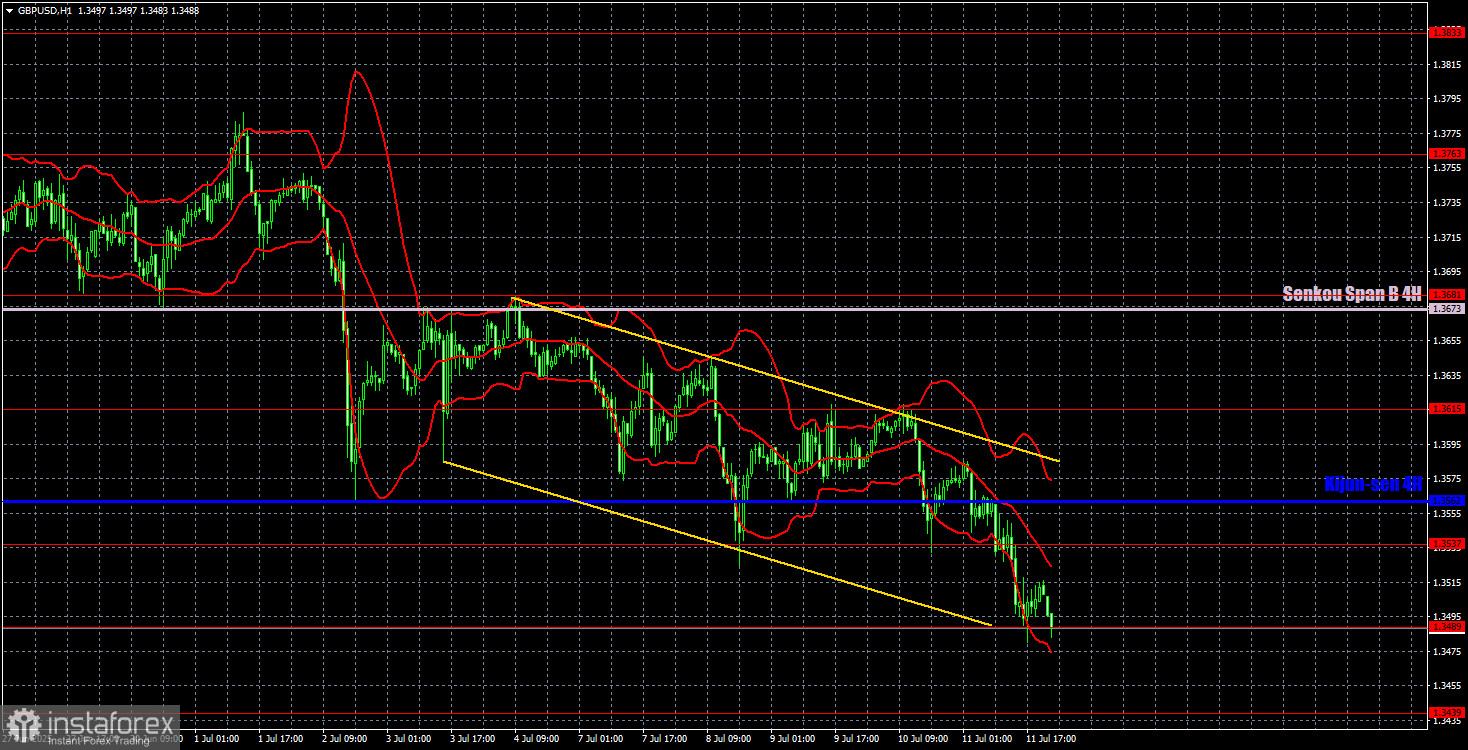
On the hourly timeframe, the technical picture is currently very clear. The pair is strictly following a descending channel and is currently near its lower boundary and the 1.3489 level. Therefore, the price could begin recovering toward the Kijun-sen critical line as early as Monday. A confirmation of the end of the local downward trend would be a breakout above the channel.

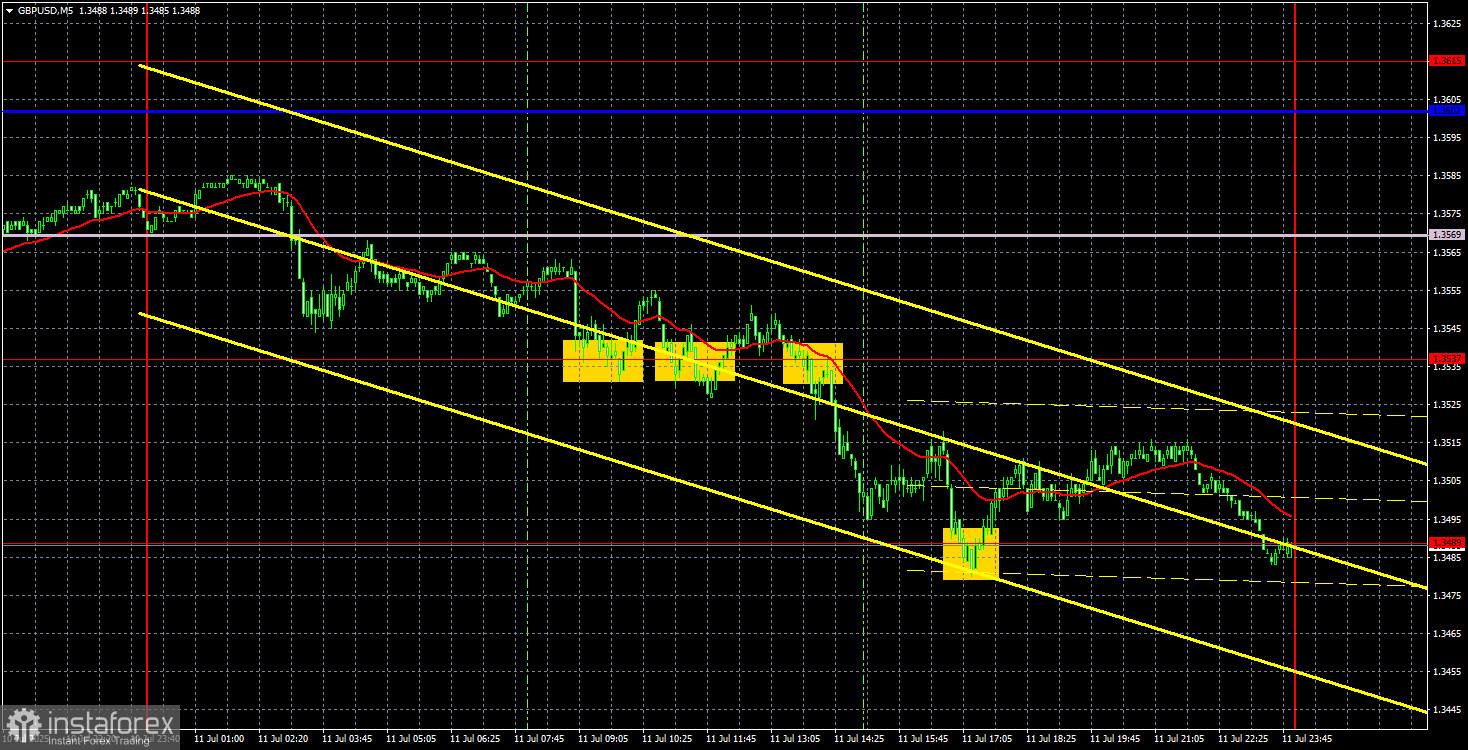
On the 5-minute timeframe, several signals formed around the 1.3537 level on Friday, but they were not of high quality. The price generated two false buy signals before forming a valid sell signal, after which the nearest target—1.3489—was reached. A rebound from the 1.3489 level could also have been traded, but it did not lead to a strong upward movement. Most likely, the trade closed at breakeven via Stop Loss.

COT Report

This image is no longer relevant

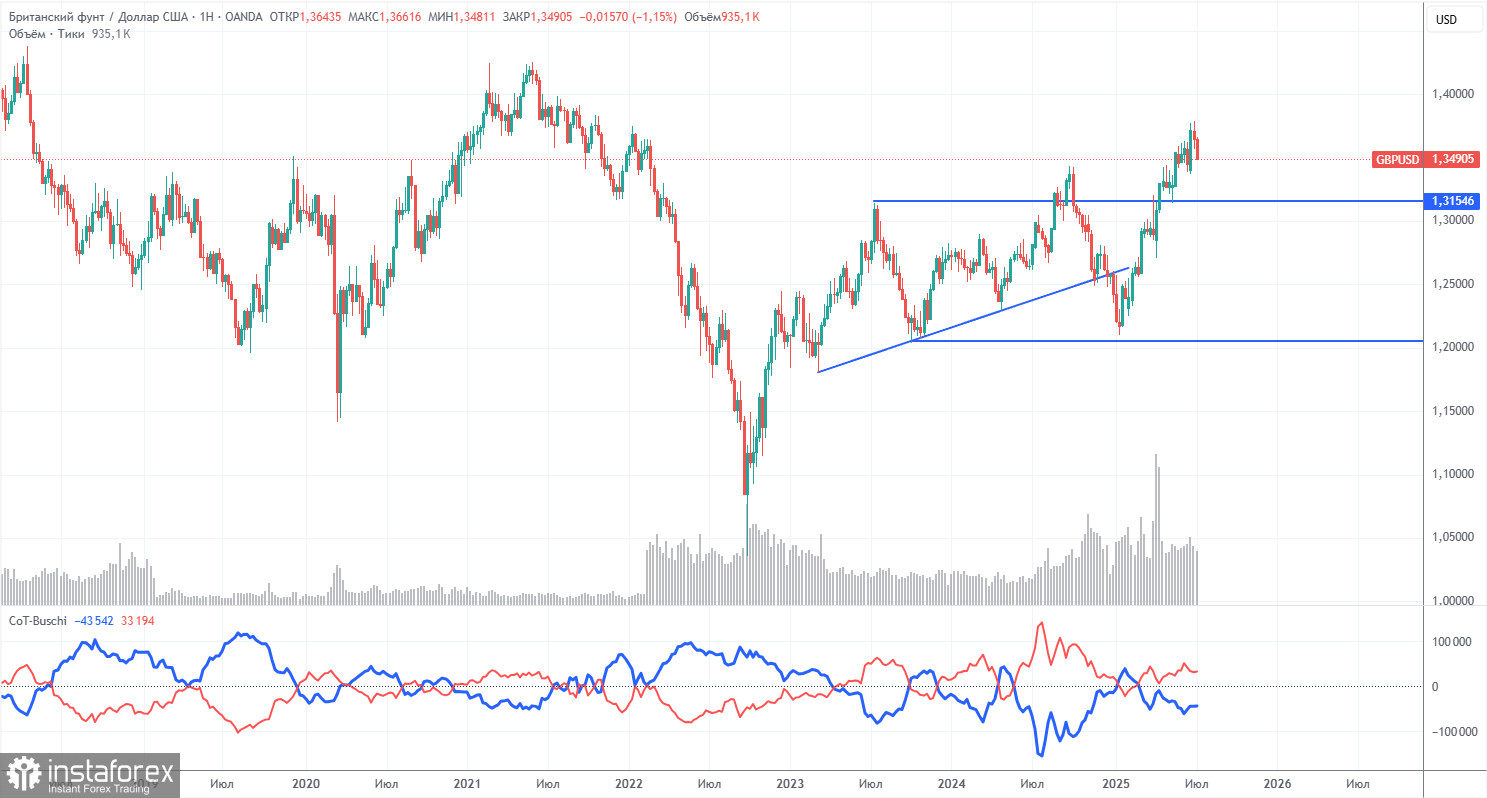
COT reports for the British pound show that in recent years, commercial traders' sentiment has changed constantly. The red and blue lines, representing the net positions of commercial and non-commercial traders, frequently cross and usually stay close to the zero line. Currently, they are also close to each other, indicating a roughly equal number of buy and sell positions. However, over the past 18 months, the net position has been growing and in recent months has been "bullish."

The dollar continues to decline due to Donald Trump's policies, so for now, the demand from market makers for the British pound is not particularly important. The trade war will continue in some form for a long time. Demand for the dollar will decline in one way or another. According to the latest report on the British pound, the "Non-commercial" group opened 800 BUY contracts and closed 900 SELL contracts. Thus, the net position of non-commercial traders increased by 1,700 contracts over the reporting week, which is practically insignificant.

The pound rose significantly in 2025, but it should be understood that the reason was Trump's policies. Once that factor is neutralized, the dollar could start to strengthen—but no one knows when that will happen. The dollar is only at the beginning of a challenging period. There are still 3.5 years left of Trump's administration.

GBP/USD 1-Hour Analysis

This image is no longer relevant

On the hourly timeframe, the GBP/USD pair continues to move downward, as indicated by the descending channel. The market ignored Trump's new tariffs last week, which is quite illogical. This behavior by traders can, of course, be explained, but we believe that the new tariffs will be priced in once the current correction is over. Therefore, for now, trading to the downside on technical grounds is acceptable, but it should be kept in mind that the dollar still lacks strong reasons to rise.

For July 14, we highlight the following important levels: 1.3212, 1.3288, 1.3358, 1.3439, 1.3489, 1.3537, 1.3615, 1.3741–1.3763, 1.3833, 1.3886. The Senkou Span B line (1.3673) and Kijun-sen line (1.3562) can also serve as sources of signals. The Stop Loss level is recommended to be set to breakeven once the price moves 20 points in the correct direction. The Ichimoku indicator lines can shift during the day, which should be considered when identifying trading signals.

There are no important events scheduled for Monday in either the UK or the U.S., but during this week, Trump may continue to raise tariffs and introduce new ones. Last week, Trump raised tariffs for only a third of the countries on his "blacklist." An increase in tariffs for the second third can be expected.

Illustration Explanations:

  • Support and resistance price levels – thick red lines where movement may end. They are not trading signal sources.
  • Kijun-sen and Senkou Span B lines—These are strong Ichimoku indicator lines transferred to the hourly timeframe from the 4-hour one.
  • Extremum levels – thin red lines where the price has previously rebounded. These act as trading signal sources.
  • Yellow lines – trend lines, trend channels, and other technical patterns.
  • COT Indicator 1 on the charts – the size of the net position for each category of traders.
Paolo Greco,
Analytical expert of InstaForex
© 2007-2025
Summary
Urgency
Analytic
Stanislav Polyanskiy
Start trade
Earn on cryptocurrency rate changes with InstaForex
Download MetaTrader 4 and open your first trade
  • Grand Choice
    Contest by
    InstaForex
    InstaForex always strives to help you
    fulfill your biggest dreams.
    JOIN CONTEST

Recommended Stories

How to Trade the GBP/USD Pair on July 22? Simple Tips and Trade Analysis for Beginners

Analysis of Monday's Trades 1H Chart of GBP/USD On Monday, the GBP/USD pair exhibited movements nearly identical to those of the EUR/USD pair. This suggests that the US dollar

Paolo Greco 06:39 2025-07-22 UTC+2

How to Trade the EUR/USD Pair on July 22? Simple Tips and Trade Analysis for Beginners

Analysis of Monday's Trades 1H Chart of EUR/USD On Monday, the EUR/USD currency pair is likely to have completed a three-week downward trend. As a reminder, over the past

Paolo Greco 06:39 2025-07-22 UTC+2

Trading Recommendations and Trade Breakdown for GBP/USD on July 22: The Pound Begins to Reverse the Trend

The GBP/USD currency pair also maintained an upward trajectory throughout Monday. The reasons were identical to those for EUR/USD. The dollar had been rising for three weeks on pure trader

Paolo Greco 03:45 2025-07-22 UTC+2

Trading Recommendations and Trade Breakdown for EUR/USD on July 22: The Dollar's Fairytale Is Over

On Monday, the EUR/USD currency pair continued its upward movement, which began last week. There were no local macroeconomic reasons for the euro's rise, but there were plenty of fundamental

Paolo Greco 03:45 2025-07-22 UTC+2

GBP/USD: Trading Plan for the European Session on July 21. Commitment of Traders (COT) Reports (Analysis of Yesterday's Trades). Pound Attempted to Recover

Last Friday, only one entry point into the market was formed. Let's look at the 5-minute chart and analyze what happened. In my morning forecast, I highlighted the 1.3442 level

Miroslaw Bawulski 08:12 2025-07-21 UTC+2

EUR/USD: Trading Plan for the European Session on July 21. Commitment of Traders (COT) Reports (Analysis of Yesterday's Trades). Euro Correction Is Nearing Its End

Only one market entry point was formed last Friday. Let's look at the 5-minute chart to see what happened. In my morning forecast, I highlighted the 1.1654 level

Miroslaw Bawulski 08:11 2025-07-21 UTC+2

How to Trade the GBP/USD Pair on July 21? Simple Tips and Trade Analysis for Beginners

Analysis of Friday's Trades 1H Chart of GBP/USD The GBP/USD pair also traded higher on Friday, but this movement had little meaningful impact. The downtrend in the British pound remains

Paolo Greco 04:01 2025-07-21 UTC+2

How to Trade the EUR/USD Pair on July 21? Simple Tips and Trade Analysis for Beginners

Analysis of Friday's Trades 1H Chart of EUR/USD On Friday, the EUR/USD currency pair continued its upward movement after rebounding twice from the 1.1563 level

Paolo Greco 04:01 2025-07-21 UTC+2

How to Trade the GBP/USD Pair on July 18? Simple Tips and Trade Analysis for Beginners

Analysis of Thursday's Trades 1H Chart of GBP/USD On Thursday, the GBP/USD pair also traded with minimal volatility. Strangely enough, there was quite a lot of interesting data released yesterday

Paolo Greco 06:13 2025-07-18 UTC+2

How to Trade the EUR/USD Pair on July 18? Simple Tips and Trade Analysis for Beginners

Analysis of Thursday's Trades 1H Chart of EUR/USD On Thursday, the EUR/USD currency pair traded in a near-flat range with very low volatility (around 50 pips). After the storm

Paolo Greco 06:13 2025-07-18 UTC+2
Can't speak right now?
Ask your question in the chat.
Widget callback
 

Dear visitor,

Your IP address shows that you are currently located in the USA. If you are a resident of the United States, you are prohibited from using the services of InstaFintech Group including online trading, online transfers, deposit/withdrawal of funds, etc.

If you think you are seeing this message by mistake and your location is not the US, kindly proceed to the website. Otherwise, you must leave the website in order to comply with government restrictions.

Why does your IP address show your location as the USA?

  • - you are using a VPN provided by a hosting company based in the United States;
  • - your IP does not have proper WHOIS records;
  • - an error occurred in the WHOIS geolocation database.

Please confirm whether you are a US resident or not by clicking the relevant button below. If you choose the wrong option, being a US resident, you will not be able to open an account with InstaForex anyway.

We are sorry for any inconvenience caused by this message.