GBP/USD
Analysis:
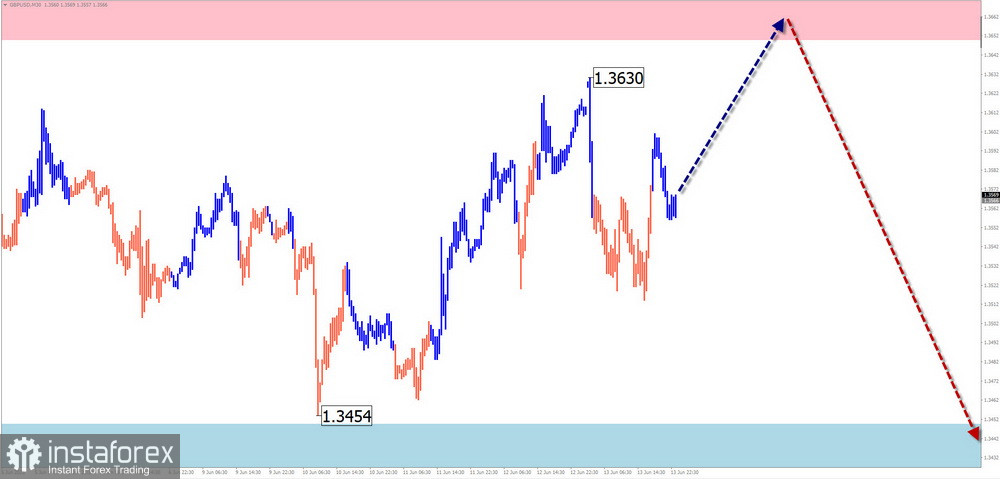
Since April, the overall direction of the British pound has been determined by an upward trend. Since mid-May, the price has been forming wave (B) as a flat correction, which remains incomplete. The quotes have reached the lower boundary of an intermediate resistance zone on the higher time frame.
Forecast:
At the start of the upcoming week, the pound is likely to complete its rise, possibly testing the resistance zone. Then, a transition to sideways price movement is expected. Toward the end of the week, a trend reversal and a decline toward the support zone become more probable.
Potential Reversal Zones:
- Resistance: 1.3650 / 1.3700
- Support: 1.3450 / 1.3400
Recommendations:
- Selling: Low potential, may carry risk.
- Buying: Premature until the correction is fully complete.
AUD/USD
Analysis:
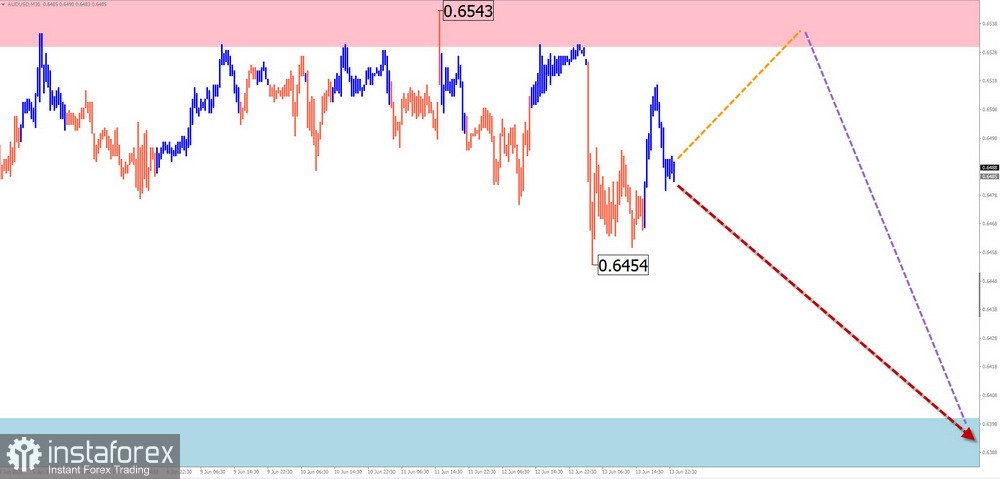
Within the dominant upward wave of the Australian dollar, the counter-trend structure that began on May 25 remains a correction. The wave does not yet appear complete. The price is moving sideways near the lower boundary of the potential daily reversal zone.
Forecast:
Following a possible attempt to test the resistance zone, a sideways movement is likely, followed by a reversal and a decline toward the support zone. Volatility is expected to increase by the end of the week.
Potential Reversal Zones:
- Resistance: 0.6530 / 0.6580
- Support: 0.6400 / 0.6350
Recommendations:
- Buying: Premature until the correction is complete.
- Selling: May be used for short-term trades upon confirmed reversal signals.
USD/CHF
Analysis:
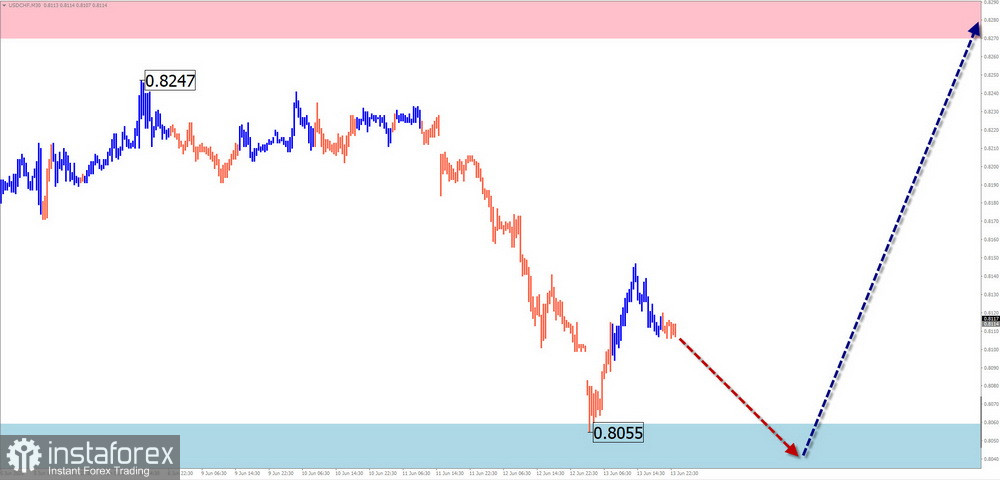
The short-term wave in the USD/CHF chart is upward and began on April 11. Since mid-May, the price has been forming a downward pullback, which remains incomplete and aligns with a typical correction.
Forecast:
In the coming days, there is a high probability of a move toward the support zone. A break below this zone is unlikely. A reversal and upward price movement may begin in the second half of the week, likely in response to key economic data.
Potential Reversal Zones:
- Resistance: 0.8270 / 0.8320
- Support: 0.8060 / 0.8010
Recommendations:
- Selling: Low potential; reduce volume size.
- Buying: Can be considered if reversal signals appear near the support zone.
EUR/JPY
Analysis:
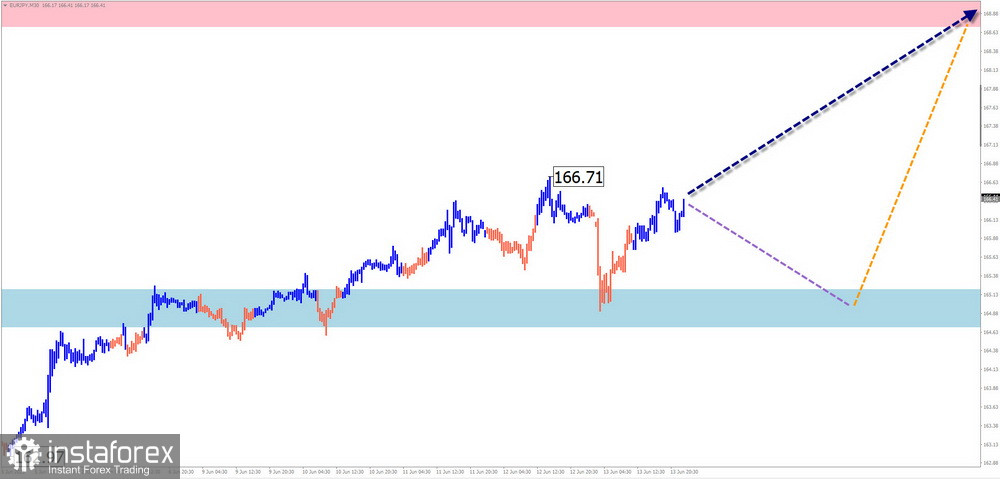
The EUR/JPY pair continues to follow an upward wave that started last summer. Since late February, it has been forming the final segment (C). At the time of analysis, the price is undergoing an intermediate pullback after breaking through another resistance level.
Forecast:
Early in the week, pressure on the support zone is possible, including a brief dip below it. A reversal and resumption of upward movement toward the resistance zone is likely afterward.
Potential Reversal Zones:
- Resistance: 168.70 / 169.20
- Support: 165.20 / 164.70
Recommendations:
- Selling: Not supported by the current conditions.
- Buying: Can be considered once confirmed reversal signals appear near support.
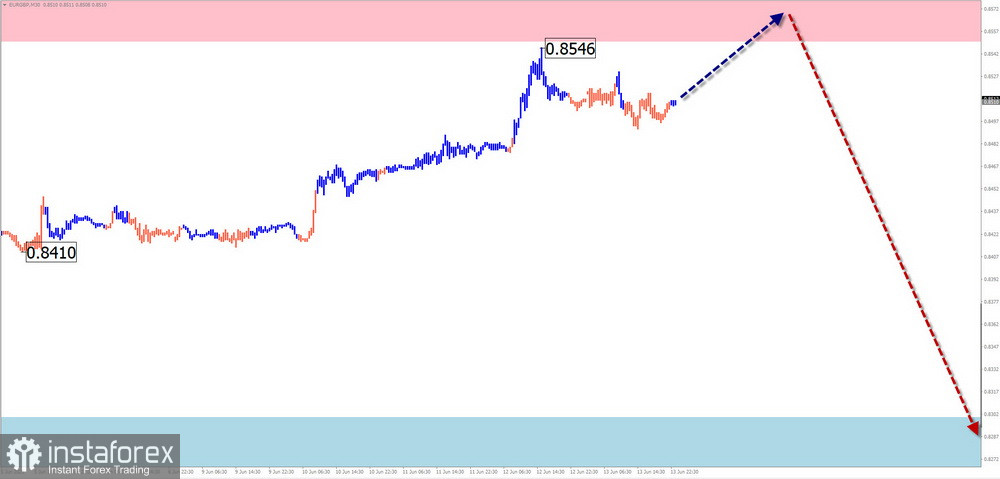
EUR/GBP
Analysis:
The bearish wave in the EUR/GBP pair that started in early April is still unfolding. Recently, a corrective segment has formed mainly as a sideways move. The final segment (C) of the main wave has yet to materialize. The price is near the lower boundary of a strong potential reversal zone.
Forecast:
After a possible upward bounce early in the week, the pair may gradually decline toward the calculated support zone. The second half of the week is expected to bring the highest volatility.
Potential Reversal Zones:
- Resistance: 0.8550 / 0.8600
- Support: 0.8300 / 0.8250
Recommendations:
- Buying: High risk, potentially unprofitable.
- Selling: May be considered once confirmed signals appear near resistance.
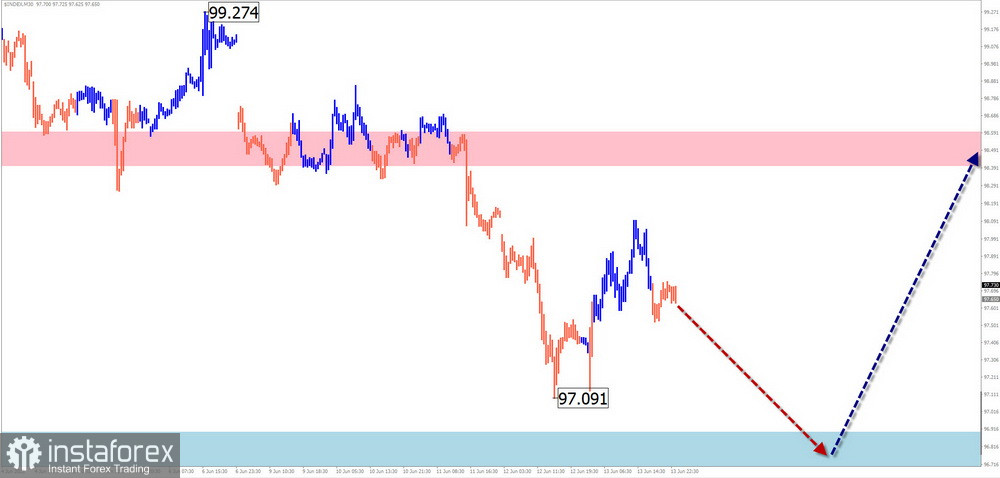
US Dollar Index (USD Index)
Analysis:
Within the dominant downtrend that began in February, the dollar index continues forming a counter-trend correction. The wave structure appears as an extended flat, with its middle section nearing completion. Once the final phase (C) begins, the short-term trend is expected to turn upward.
Forecast:
In the first half of the upcoming week, the index is likely to move downward. A reversal and renewed upward momentum from the support zone is expected later in the week. The calculated resistance zone reflects the likely upper boundary for weekly price swings.
Potential Reversal Zones:
- Resistance: 98.40 / 98.60
- Support: 96.90 / 96.70
Recommendations:
The period of temporary weakness in the U.S. dollar is likely ending. The optimal strategy for the week is to focus on selling national currencies in major pairs, once reversal signals appear.
Note: In simplified wave analysis (SWA), all waves consist of three parts (A-B-C). Only the last, incomplete wave is analyzed at each time frame. Dashed lines indicate expected movements.
Caution: The wave algorithm does not account for the duration of market movements in time.