empty
04.06.2025 10:05 AM
Forecast for GBP/USD on June 4, 2025

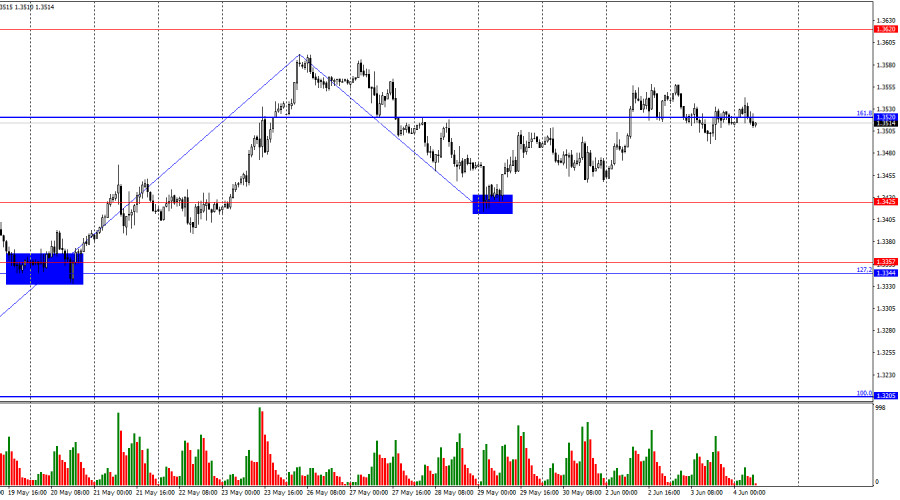
On the hourly chart, the GBP/USD pair showed no interest in movement on Tuesday. Throughout the day, bulls and bears launched weak attacks, none of which led to anything significant. The movement was horizontal, and the 161.8% retracement level at 1.3520 is being ignored by traders. Thus, no trading signals should be expected around it today.

This image is no longer relevant

The wave situation clearly indicates the continuation of the "bullish" trend. The last upward wave broke above the previous wave's peak, and the last downward wave did not break below the previous low. It will be hard for the bulls to count on further growth without new announcements from Donald Trump about increasing or introducing new import tariffs. However, the U.S. president seems ready to keep escalating tariffs and take the trade war with China to a new level. Thus, bulls have reasons for fresh attacks this week.

On Tuesday, there was no news from the U.K., but one report was released in the U.S., which no one really paid attention to. Just a reminder — this week a full set of U.S. labor market and unemployment data will be released. Yesterday it was revealed that the number of job openings in April rose from 7.2 million to 7.391 million, exceeding the forecast of 7.1 million. Thus, traders expected a decline in this indicator due to the trade war, but in fact, the figure grew. This is a very positive signal for the American economy — but unfortunately, not for the dollar or the bears. The ADP, ISM, Nonfarm Payrolls reports, and the unemployment rate, all set to be released later this week, could also bring positive numbers. But will they be enough for the bears to launch an attack? Let me remind you — there is very little interest in buying dollars right now due to Trump's new trade policy (if it can even be called a trade war). Thus, in my opinion, even good labor market data may not help the dollar much.

This image is no longer relevant

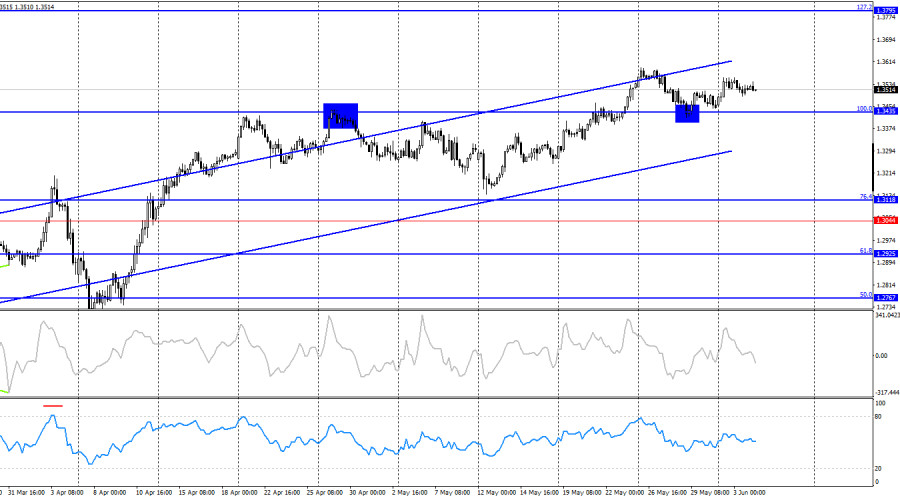
On the 4-hour chart, the pair consolidated above the 100.0% Fibonacci level at 1.3435 and then bounced off it from above. Thus, the upward movement may continue toward the next retracement level of 127.2% at 1.3795. No divergences are forming today on any indicator. The bullish trend currently leaves little room for doubt, but a close below 1.3435 would allow expectations for a decline toward the 76.4% retracement level at 1.3118.

Commitments of Traders (COT) Report:

This image is no longer relevant

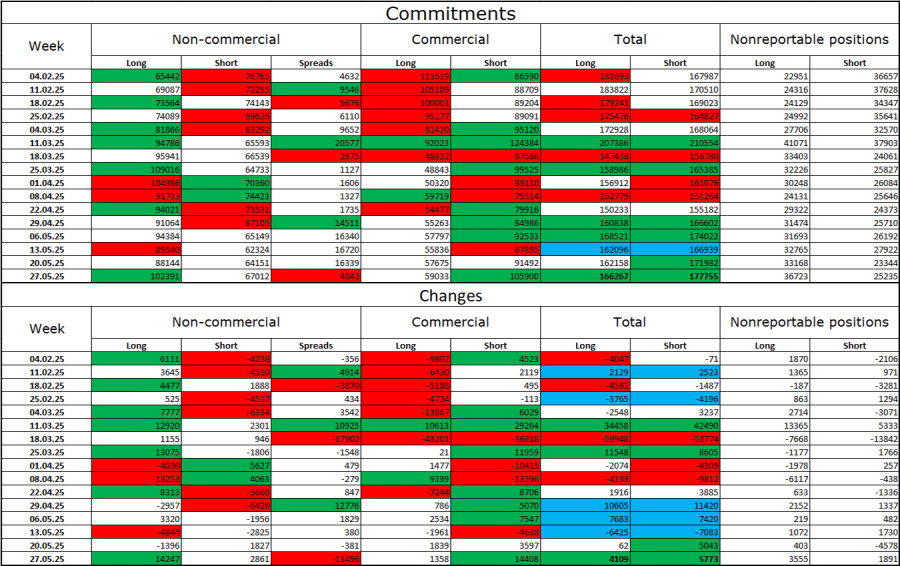
Sentiment among the "Non-commercial" category of traders became much more "bullish" over the last reporting week. The number of long positions held by speculators increased by 14,247, while the number of short positions rose by only 2,861. Bears have long lost their advantage in the market. The gap between long and short positions is now 35,000 in favor of the bulls: 102,000 vs. 67,000.

In my view, the pound still faces prospects for decline, but recent events are reversing the market trend in the long term. Over the past three months, the number of long positions has risen from 65,000 to 102,000, while the number of shorts has decreased from 76,000 to 67,000. Under Trump, faith in the dollar has weakened, and the COT reports show there's little desire among traders to buy the dollar. Thus, no matter how the news background looks in general, for now, the dollar is only falling due to the events surrounding Trump.

News Calendar for the U.S. and U.K.:

  • United Kingdom — S&P Services PMI (08:30 UTC)
  • United States — ADP Employment Change (12:15 UTC)
  • United States — S&P Services PMI (13:45 UTC)
  • United States — ISM Services PMI (14:00 UTC)

On Wednesday, the economic calendar contains four entries, with the ISM index standing out. The news background could have a medium-strength impact on trader sentiment today, especially in the second half of the day.

GBP/USD Forecast and Trading Advice:

Trading signals today should not be sought around the 1.3520 level. It is better to use other hourly chart levels if the price reaches them.

The Fibonacci grids are drawn based on 1.3205–1.2695 on the hourly chart and 1.3431–1.2104 on the 4-hour chart.

Samir Klishi,
Analytical expert of InstaForex
© 2007-2025
Select timeframe
5
min
15
min
30
min
1
hour
4
hours
1
day
1
week
Earn on cryptocurrency rate changes with InstaForex
Download MetaTrader 4 and open your first trade
  • Grand Choice
    Contest by
    InstaForex
    InstaForex always strives to help you
    fulfill your biggest dreams.
    JOIN CONTEST

Recommended Stories

USD/JPY. Analysis and Forecast. Current Market Situation

From a technical perspective, as bulls have overcome the barrier of the 100-day Simple Moving Average (SMA) around the 146.80 level, they remain in control. Buying beyond the psychological level

Irina Yanina 17:53 2025-06-23 UTC+2

Trading Signals for EUR/USD for June 23-28, 2025: buy above 1.1460 (21 SMA - 6/8 Murray)

On the contrary, this area around the 21SMA, located at the psychological level of 1.15, is key. Below this area, we could expect a sharp breakout of the uptrend channel

Dimitrios Zappas 16:34 2025-06-23 UTC+2

Trading Signals for GOLD (XAU/USD) for June 23-28, 2025: buy above $3,350 (21 SMA - 7/8 Murray)

If gold continues its recovery and settles above the 21 SMA at 3,364, this could be seen as a buying opportunity with targets at 8/8 Murray at 3,437. The metal

Dimitrios Zappas 16:23 2025-06-23 UTC+2

Forex forecast 23/06/2025: EUR/USD, GBP/USD, USDX, Oil, Ethereum and Bitcoin

Useful links: My other articles are available in this section InstaForex course for beginners Popular Analytics Open trading account Important: The begginers in forex trading need to be very careful

Sebastian Seliga 12:08 2025-06-23 UTC+2

Technical Analysis for the Week of June 23–28: GBP/USD Currency Pair

Last week, the pair moved downward and tested the 14.6% pullback level at 1.3392 (red dashed line), after which the price rebounded and closed the weekly candle at 1.3446

Stefan Doll 11:38 2025-06-23 UTC+2

Technical Analysis for the Week of June 23–28: EUR/USD Currency Pair

Last week, the pair moved downward and tested the 76.4% pullback level at 1.1452 (red dashed line), after which the price rebounded and closed the weekly candle at 1.1520

Stefan Doll 11:31 2025-06-23 UTC+2

Forecast for EUR/USD on June 23, 2025

On Friday, the EUR/USD pair continued to rise after rebounding from the 76.4% corrective level at 1.1454. However, on Monday night, the pair returned to this level. A new rebound

Samir Klishi 11:24 2025-06-23 UTC+2

Forecast for GBP/USD on June 23, 2025

On the hourly chart, the GBP/USD pair on Friday consolidated below the support zone of 1.3425–1.3444, once again allowing for the expectation of a continued decline toward the support level

Samir Klishi 11:19 2025-06-23 UTC+2

Technical Analysis of Daily Price Movement of USD/IDR Exotic Currency Pairs, Monday June 23, 2025.

16473.27 Currently on the Daily chart, the Exotic USD/IDR currency pair has a Bullish 123 pattern which indicates that USD/IDR is currently strengthening, where this is also confirmed

Arief Makmur 07:29 2025-06-23 UTC+2

Technical Analysis of Intraday Price Movement of Crude Oil Commodity Instrument, Monday June 23, 2025.

In addition to the appearance of Divergence between the price movement of Crude Oil and the Stochastic Oscillator indicator on the 4-hour chart, there is also a Bearish 123 pattern

Arief Makmur 07:29 2025-06-23 UTC+2
Can't speak right now?
Ask your question in the chat.
Widget callback