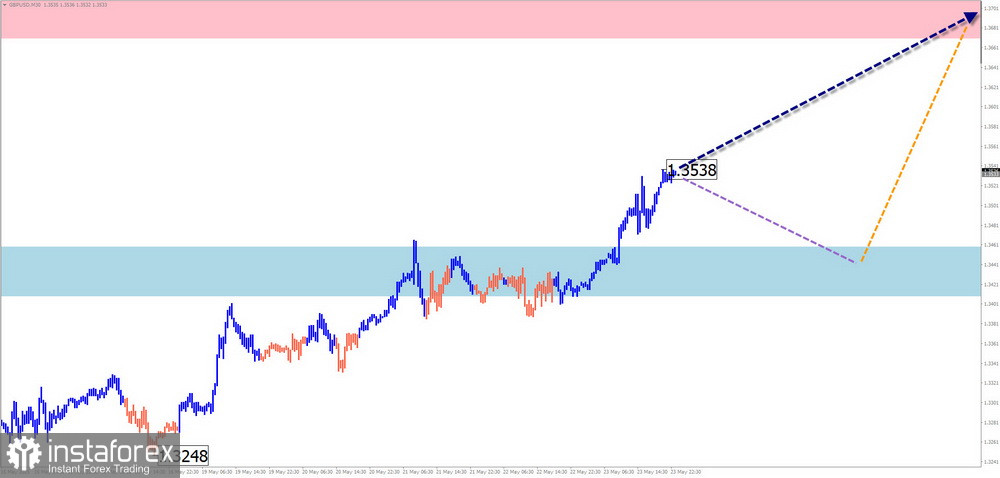
GBP/USD
Analysis: Since January, the British pound has been trending upward. The current incomplete segment began on April 8. Within this wave, the final segment remains unfinished. The price has broken through a key intermediate resistance zone on the daily timeframe, which has now turned into support. For the wave to continue, the price needs to consolidate above this area.
Forecast: A sideways movement is expected next week. Early in the week, a downward bias is likely, potentially putting pressure on the lower support boundary. A reversal and upward move toward resistance are expected later, though further growth beyond that within the week is unlikely.
Potential Reversal Zones
- Resistance: 1.3670 / 1.3720
- Support: 1.3460 / 1.3410
Recommendations:
- Purchases: Possible from the support zone; upward potential is limited by resistance.
- Sales: Risky for the account balance.
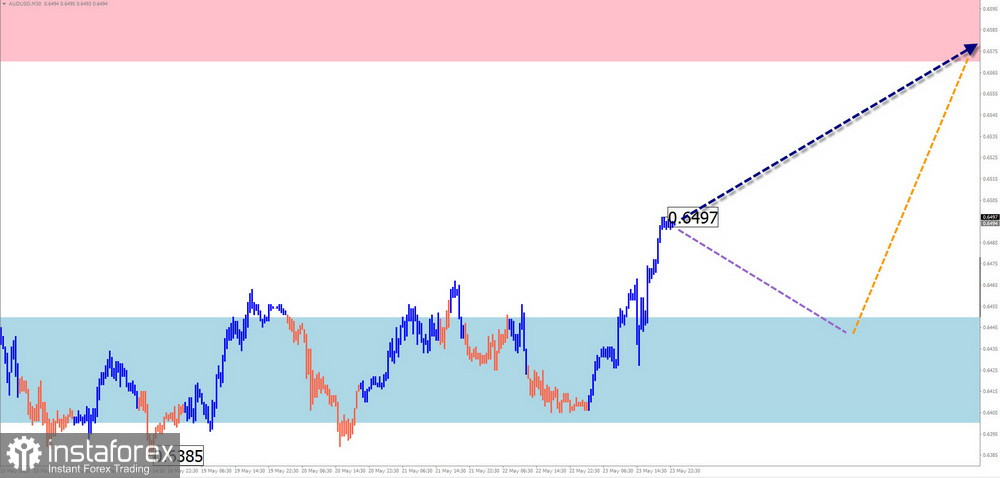
AUD/USD
Analysis: Since April, a bullish zigzag wave has been forming on the 4-hour chart. In the final wave (C), a corrective segment is currently developing. The wave extremes form a horizontal pennant.
Forecast: Sideways movement along the support zone is expected in the early part of the week. A pullback toward support is possible, followed by a potential reversal. The most active phase is likely closer to the weekend. The resistance zone defines the upper boundary of the expected weekly range.
Potential Reversal Zones
- Resistance: 0.6570 / 0.6620
- Support: 0.6450 / 0.6400
Recommendations:
- Purchases: Possible with a reduced volume size if signals appear near support.
- Sales: Risky and potentially loss-making; best avoided.
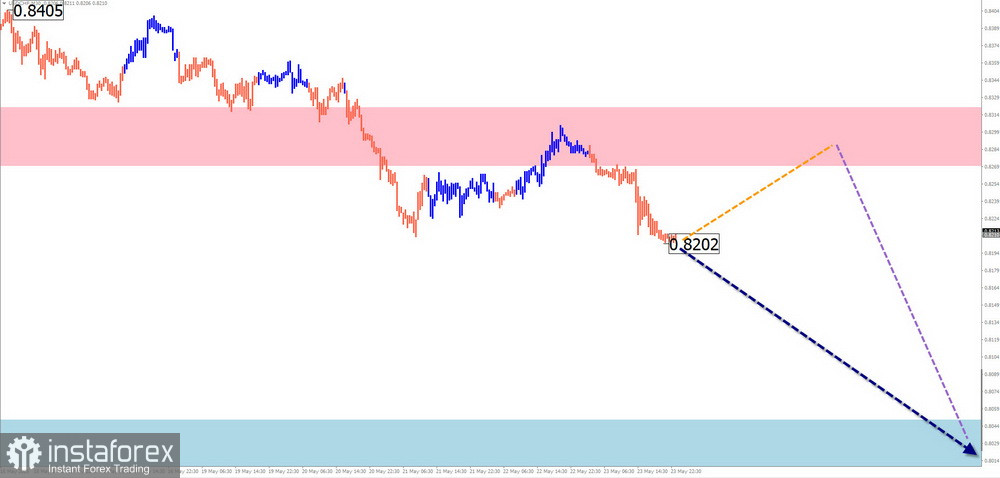
USD/CHF
Analysis: The dominant downtrend in the Swiss franc pair has brought the price near the lower boundary of a potential weekly reversal zone. Since April 11, the pair has been moving sideways, forming a contracting flat.
Forecast: Attempts at an upward retracement and testing resistance are likely early in the week. A brief break above the upper boundary cannot be ruled out. A reversal may form in the following days, with a renewed downtrend expected closer to the weekend.
Potential Reversal Zones
- Resistance: 0.8270 / 0.8320
- Support: 0.8050 / 0.8000
Recommendations:
- Purchases: Possible in small volumes during select sessions.
- Sales: Premature until confirmed reversal signals appear near resistance.
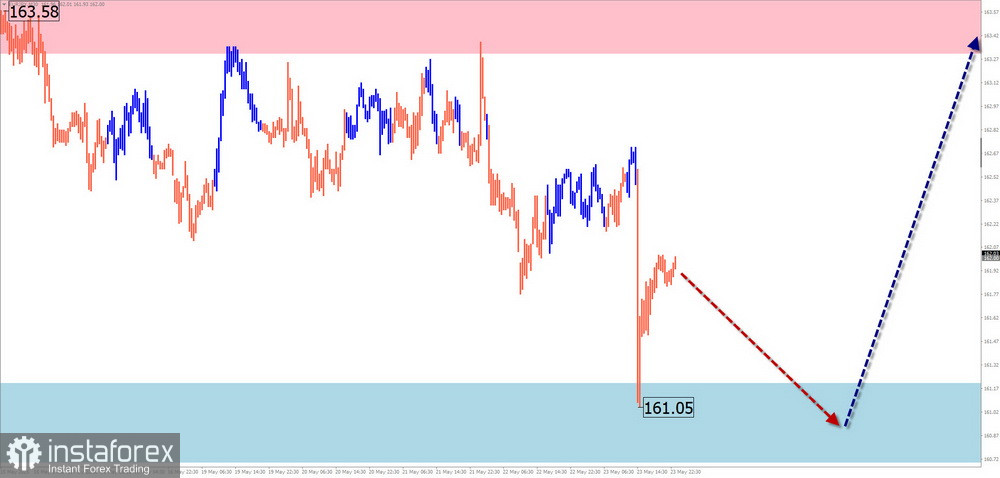
EUR/JPY
Analysis: In the short term, EUR/JPY has been following a bearish wave that started on April 29. A contracting flat is forming, with wave (B) currently in progress. The price is nearing the lower boundary of a potential reversal zone, but no clear reversal signals are yet visible.
Forecast: Expect flat trading at the start of the week, with a bearish tilt. In the second half of the week, volatility may increase, with a potential reversal and beginning of an upward move. The range of movement is defined by the support and resistance zones.
Potential Reversal Zones
- Resistance: 163.30 / 163.80
- Support: 161.20 / 160.70
Recommendations:
- Sales: Possible in small volumes during specific sessions; downside is limited by support.
- Buys: Premature until reversal signals appear near support.
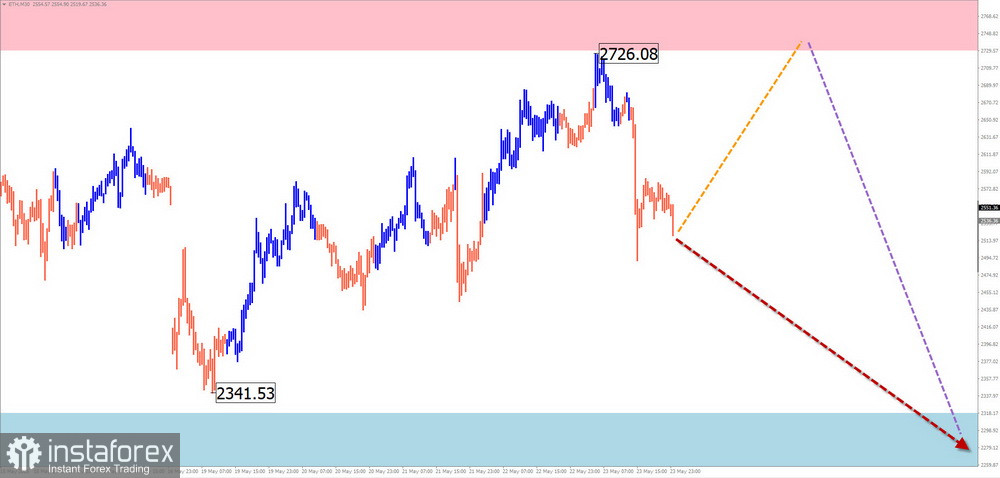
Ethereum
Analysis: Since November, Ethereum has been trending lower. The structure of the last wave suggests the corrective segment (B) has ended. The downward leg since May 13 shows reversal potential. If confirmed, this could signal a change in the short-term trend.
Forecast: Sideways movement is expected next week. Temporary pressure on resistance is possible. A brief break of the upper boundary of the support zone may occur. Toward the end of the week, the likelihood of a trend reversal and decline increases.
Potential Reversal Zones
- Resistance: 2730.0 / 2780.0
- Support: 2320.0 / 2270.0
Recommendations:
- Purchases: Risky, lacking potential.
- Sales: May be used in small volumes during individual sessions after reversal signals appear; downside is limited by support.
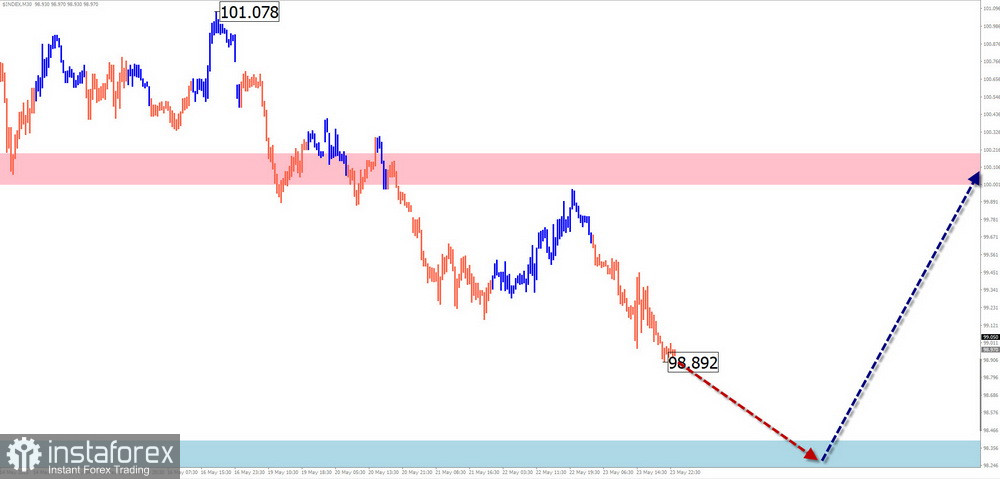
US Dollar Index
Analysis: Within the dominant downward wave, an incomplete sideways segment has been forming since April 11. The corrective structure resembles a contracting flat. The price is currently trapped in a narrow channel between multiple levels of support and resistance of various scales.
Forecast: The index is expected to continue sideways next week. After a probable decline to support, another upward attempt is possible. The resistance zone will cap the dollar's weekly range.
Potential Reversal Zones
- Resistance: 100.00 / 100.20
- Support: 98.40 / 98.20
Recommendations: The weakening of the U.S. dollar may end this week, after which a recovery in the uptrend could begin.
Note: In Simplified Wave Analysis (SWA), all waves consist of 3 parts (A–B–C). The last, incomplete wave is analyzed on each timeframe. Dashed lines indicate expected price movement.
Attention: The wave algorithm does not take into account the duration of market moves over time.