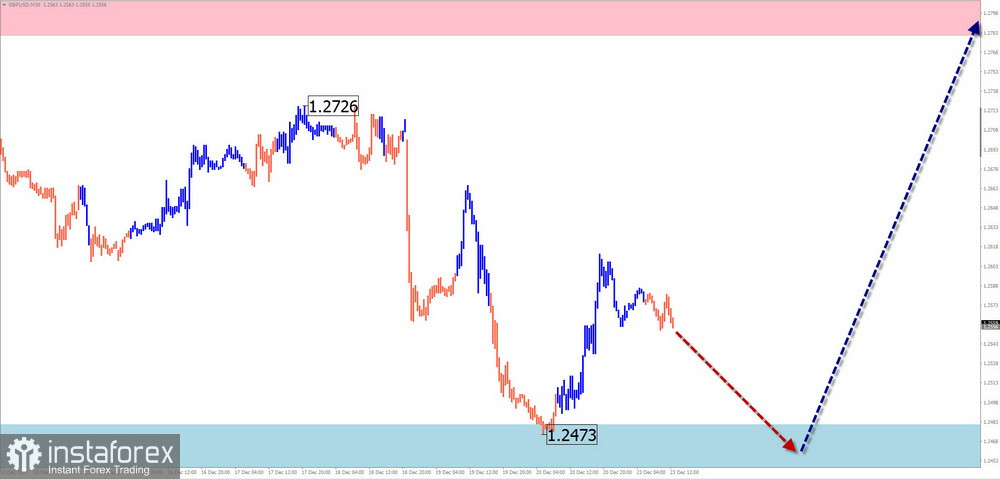
GBP/USD
Summary Analysis:The dominant wave for GBP/USD has been upward for the past few years, establishing a new short-term trend. Currently, the price is near the lower boundary of a strong resistance zone, forming a corrective wave (B) since late August. Although the wave structure appears complete, no clear reversal signals are evident on the chart.
Weekly Forecast:For most of the upcoming week, GBP/USD is expected to move within the range between nearby zones. After testing the support zone, a reversal and a change in direction are likely. A breakout above the resistance range within the weekly movement is unlikely.
Potential Reversal Zones:
- Resistance: 1.2780–1.2820
- Support: 1.2480–1.2430
Recommendations:
- Buying: Consider after confirmed reversal signals near the support zone based on your trading system.
- Selling: High risk and potentially unprofitable.
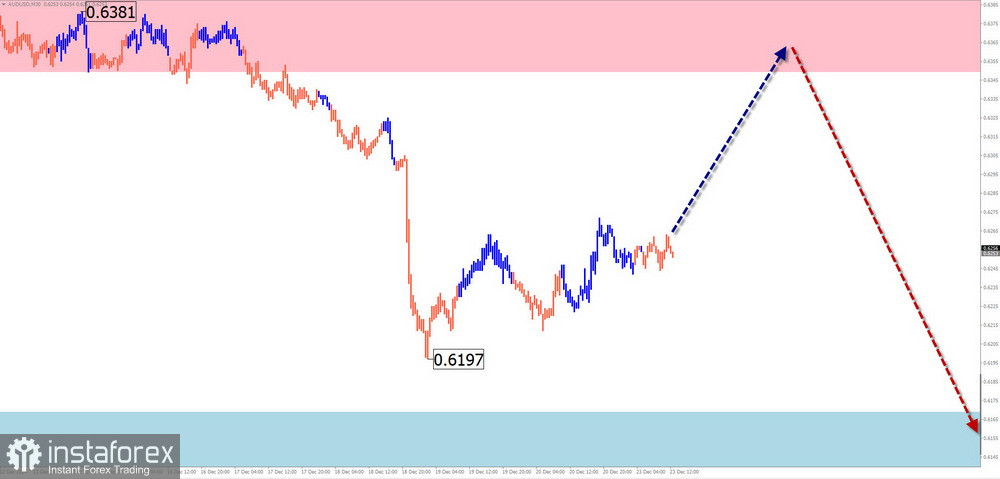
AUD/USD
Summary Analysis:A downward wave has been forming for AUD/USD since late September. Last week, the pair developed a stretched corrective flat in a sideways range. The price broke below intermediate support, which has now become resistance. A consolidation above this level is needed before the decline resumes.
Weekly Forecast:At the start of the week, expect a short-term upward rebound, limited by the resistance zone. The bearish trend is likely to resume, pushing the price toward the support range.
Potential Reversal Zones:
- Resistance: 0.6350–0.6400
- Support: 0.6170–0.6120
Recommendations:
- Buying: Limited potential and may lead to losses.
- Selling: Consider after confirmed reversal signals near the support zone based on your trading system.
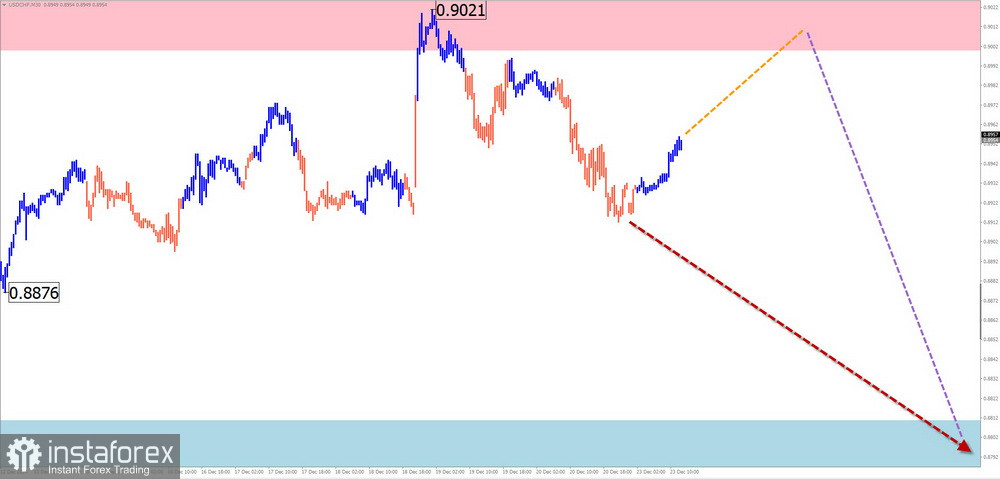
USD/CHF
Summary Analysis:The short-term direction of USD/CHF has been upward since August 5. The wave structure appears complete, and the price has reached the preliminary target zone. However, there are no immediate reversal signals on the chart.
Weekly Forecast:Expect sideways movement near the calculated resistance zone early in the week. Toward the weekend, there is a higher probability of increased volatility and a potential price decline. Brief breaches of the resistance boundary cannot be ruled out.
Potential Reversal Zones:
- Resistance: 0.9000–0.9050
- Support: 0.8810–0.8760
Recommendations:
- Buying: Use small volume sizes for specific sessions and close trades at the first sign of reversal.
- Selling: Consider after confirmed reversal signals near the resistance zone.
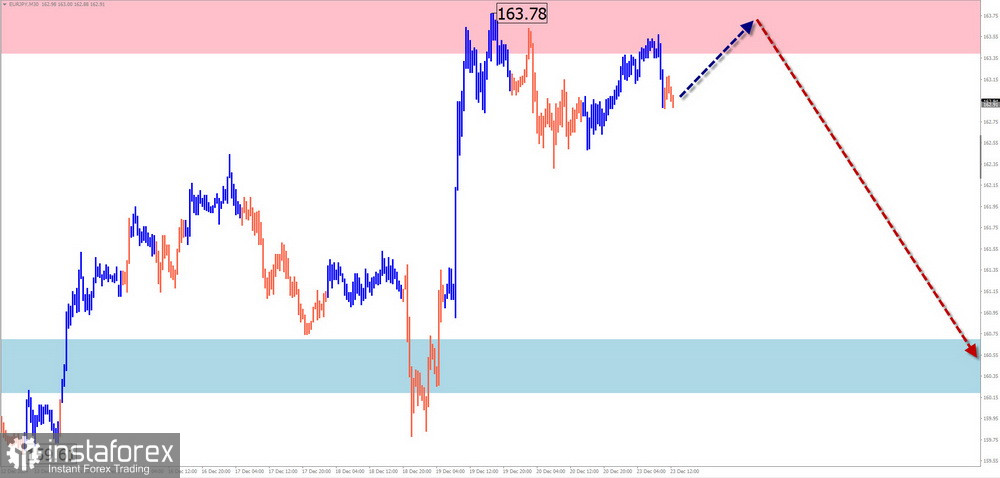
EUR/JPY
Summary Analysis:The upward wave for EUR/JPY, which began on December 3, remains unfinished. Late last week, the price reached the lower boundary of a strong potential reversal zone on a higher timeframe. Since December 19, a counter-directional wave with reversal potential has started forming.
Weekly Forecast:The price is expected to move from the resistance zone toward the calculated support zone during the week. A breakout beyond these zones is unlikely within the weekly timeframe.
Potential Reversal Zones:
- Resistance: 163.40–163.90
- Support: 160.70–160.20
Recommendations:
- Buying: Not recommended in the coming days.
- Selling: Consider after confirmed reversal signals near the resistance zone based on your trading system.
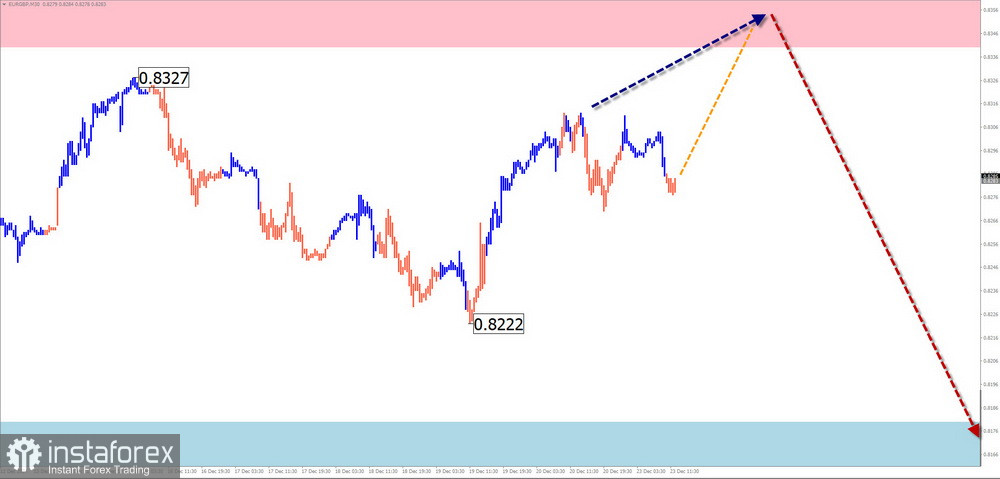
EUR/GBP
Summary Analysis:The short-term movements of EUR/GBP have been driven by a downward wave since March 19. The final segment (C) is forming a horizontal correction that remains incomplete.
Weekly Forecast:Sideways movement is likely at the beginning of the week, with a potential upward bias. A reversal and renewed downward movement are expected near the resistance zone. The weekly decline will likely be limited by the calculated support zone.
Potential Reversal Zones:
- Resistance: 0.8340–0.8390
- Support: 0.8180–0.8130
Recommendations:
- Buying: Limited potential; consider splitting trade volumes for reduced risk.
- Selling: Enter after confirmed reversal signals near the resistance zone.
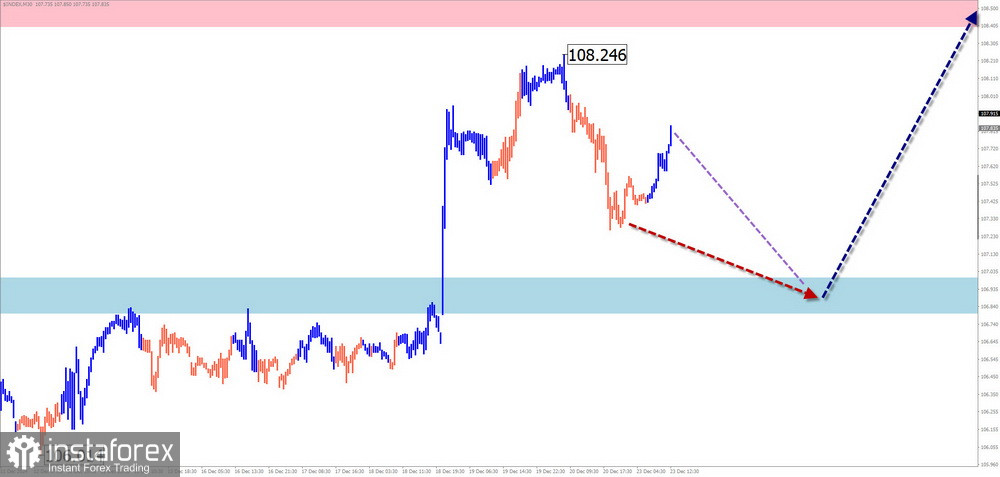
US Dollar Index
Summary Analysis:The upward wave for the US Dollar Index, which began in late September, is ongoing. After breaking through strong resistance in mid-December, the price established a base for further growth, though it needs consolidation at current levels.
Weekly Forecast:Expect the index to complete its downward retracement within the first few days of the week. A reversal and resumption of the upward movement are likely in the second half, with gains extending toward the resistance zone.
Potential Reversal Zones:
- Resistance: 108.40–108.60
- Support: 107.00–106.80
Recommendations:
- Strengthening: Gains for major currencies will be short-lived. Wait for confirmed reversal signals near the support zone before entering trades to strengthen the US dollar.
Notes on Simplified Wave Analysis:
- All waves consist of three segments (A-B-C). The analysis focuses on the last incomplete wave for each timeframe.
- Dashed lines represent expected movements.
- The wave algorithm does not account for the time duration of price movements.