empty
13.03.2020 02:35 AM
Comprehensive analysis of movement options of #USDX vs Gold & Silver (H4) for March 13, 2020

Did the strength change? Metals down – dollar up? Here's a comprehensive analysis of movement options of #USDX vs Gold & Silver (H4) for March 13, 2020

Minuette operational scale (H4)

____________________

US dollar index

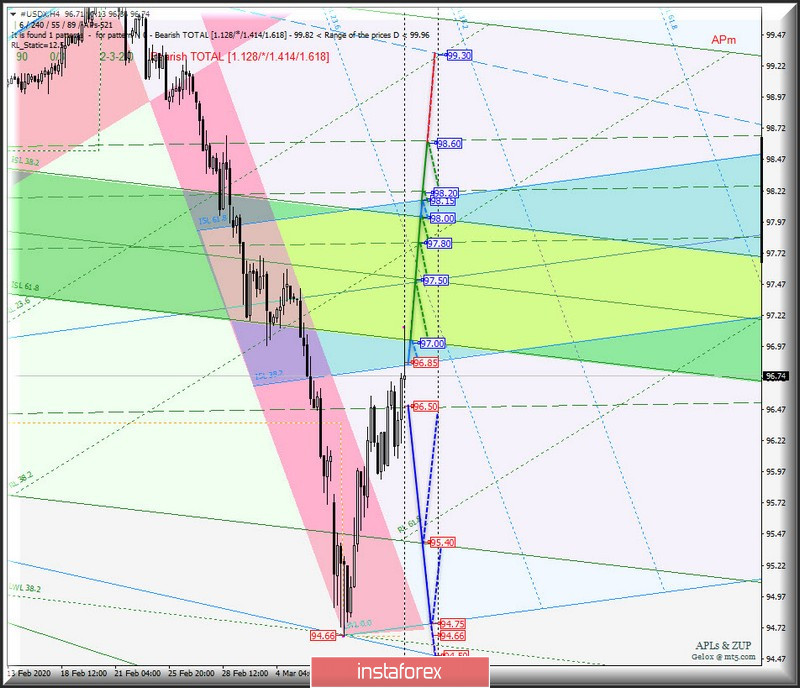
The movement #USDX to March 13, 2020 due to the processing and the direction of the breakdown range :

  • resistance level of 96.85 at the lower boundary of ISL38.2 equilibrium zone of the Minuette operational scale forks ;
  • support level of 96.50 on the ultimate Schiff Line of the Minuette operational scale forks.

The breakdown of ISL38.2 (resistance level of 96.85) Minuette, followed by breakdown of ISL61.8 Minuette (97.00) will determine the development of the movement of the dollar index within the boundaries of the equilibrium zones of the Minuette operational scale forks (96.85 - 97.50 - 98.15) and Minuette (97.00 - 97.50 - 98.00), as well as the 1/2 Median Line Minuette channel (97.80 - 98.20 - 98.60).

On the other hand, the breakdown of the final Schiff Line Minuette (support level of 96.50) will enable the development of the downward movement of #USDX to the final FSL line (95.40) of the Minuette operational scale forks and initial line SSL (94.75) of the Minuette operational scale forks.

The markup of #USDX movement options from March 13, 2020 is shown on the animated chart.

This image is no longer relevant

____________________

Spot Gold

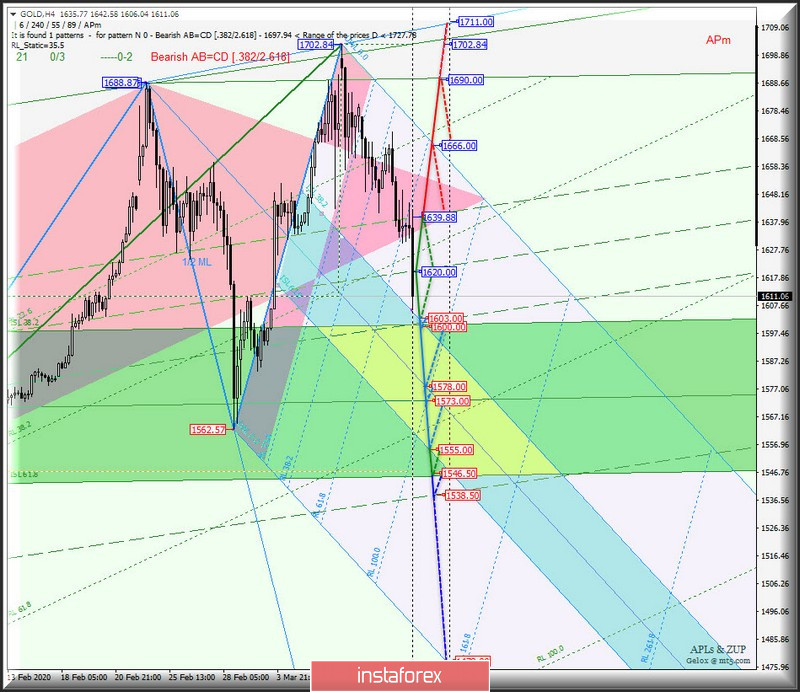
From March 13, 2020, the development of the Spot Gold movement will continue to be determined by the development and direction of the breakdown of the boundaries of 1/2 Median Line channel (1639.88 - 1620.00 - 1600.20) of the Minuette operational scale forks. The details of the movement of Spot Gold is presented on the animated chart.

The breakdown of the lower boundary of the 1/2 Median Line Minuette channel (support level of 1600.00) will determine the development of Spot Gold movement within the boundaries of the equilibrium zones of the Minuette operational scale forks (1603.00 - 1578.00 - 1555.00) and Minuette (1600.00 - 1573.00 - 1546.00).

Alternatively, in case of breakdown of the upper boundary (resistance level of 1639.88) of the 1/2 Median Line channel of the Minuette operational scale forks is an option for the development of Spot Gold upward movement to the initial SSL line (1666.00) of the Minuette operational scale forks and SSL Minuette start line (1690.00).

The details of the Spot Gold movement options from March 13, 2020 are shown on the animated chart.

This image is no longer relevant

____________________

Spot Silver

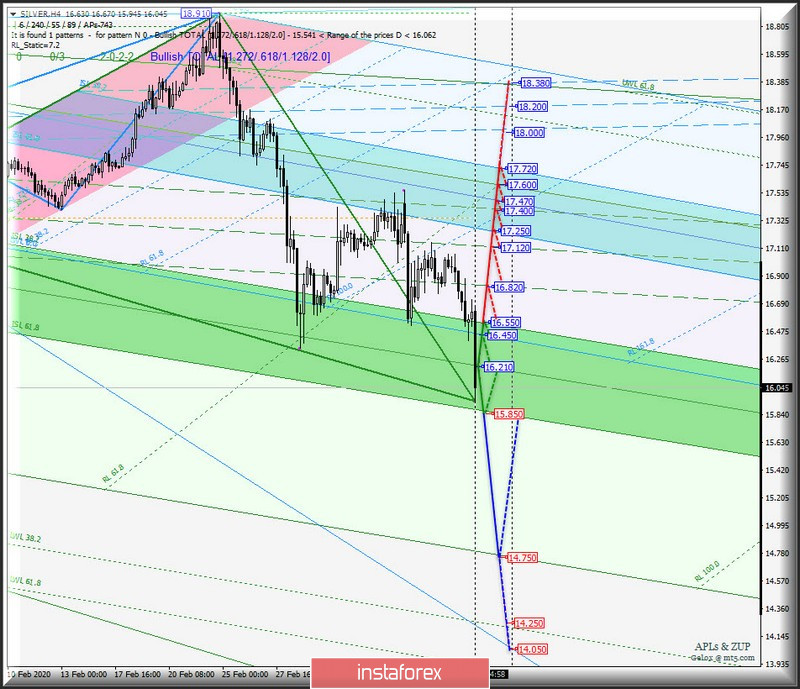
The development and direction of the breakdown of the boundaries of the equilibrium zone (16.550 - 16.210 - 15.850) of the Minuette operational scale forks will begin to determine the development of the Spot Silver movement from March 13, 2020. We look at the details of the development of the indicated levels on the animated chart.

The breakdown of the support level of 15.850 at the lower boundary of the ISL61.8 equilibrium zone of the Minuette operational scale forks is a continuation of the downward movement of Spot Silver to the final line FSL Minuette (14.750).

In contrast, the breakdown of the resistance level of 16.550 on the upper boundary of the ISL38.2 equilibrium zone of the Minuette operational scale forks, the Spot Silver movement will be directed to the boundaries of the 1/2 Median Line Minuette channel (16.820 - 17.120 - 17.400) and the equilibrium zone (17.250 - 17.470 - 17.720) of the Minuette operational scale forks.

The details of the Spot Silver movement from March 13, 2020 can be seen on the animated chart.

This image is no longer relevant

____________________

The review is made without taking into account the news background. Thus, the opening of trading sessions of major financial centers does not serve as a guide to action (placing orders "sell" or "buy").

The formula for calculating the dollar index :

USDX = 50.14348112 * USDEUR0.576 * USDJPY0.136 * USDGBP0.119 * USDCAD0.091 * USDSEK0.042 * USDCHF0.036.

where the power coefficients correspond to the weights of the currencies in the basket:

Euro - 57.6% ;

Yen - 13.6% ;

Pound Sterling - 11.9% ;

Canadian dollar - 9.1%;

Swedish krona - 4.2%;

Swiss franc - 3.6%.

The first coefficient in the formula leads the index to 100 at the starting date - March 1973, when the main currencies began to be freely quoted relative to each other.

Ratu Taslim,
Analytical expert of InstaForex
© 2007-2025
Select timeframe
5
min
15
min
30
min
1
hour
4
hours
1
day
1
week
Earn on cryptocurrency rate changes with InstaForex
Download MetaTrader 4 and open your first trade
  • Grand Choice
    Contest by
    InstaForex
    InstaForex always strives to help you
    fulfill your biggest dreams.
    JOIN CONTEST

Recommended Stories

Despite the potential for a correction, gold still has the potential to strengthen today, Friday, July 11, 2025.

XAU/USD, Friday, July 11, 2025. Although it appears to have corrected due to being held at Resistance 1, the continued strength of XAU/USD's technical and fundamental conditions provides an opportunity

Arief Makmur 08:00 2025-07-11 UTC+2

EUR/USD Forecast for July 11, 2025

EUR/USD On the weekly chart, we observe a set of reversal signals: divergence, a trend shift in the Fibonacci time zone, and a price rebound from the intersection

Laurie Bailey 07:09 2025-07-11 UTC+2

GBP/USD Forecast for July 11, 2025

GBP/USD On the monthly chart, the British pound reversed from the 161.8% Fibonacci reaction level, calculated from the upper boundary of the global 18-year price channel, immediately after

Laurie Bailey 06:46 2025-07-11 UTC+2

USD/CAD Forecast for July 11, 2025

USD/CAD The Canadian dollar had been consolidating for three days before today's upward breakout during the Pacific session. The price has already pierced the balance line with its upper shadow

Laurie Bailey 06:42 2025-07-11 UTC+2

Forecast for EUR/USD on July 10, 2025

On Wednesday, the EUR/USD pair continued to move along a trajectory known only to itself. The 127.2% Fibonacci correction level at 1.1712 was once again ignored by traders. I still

Samir Klishi 12:21 2025-07-10 UTC+2

Forecast for GBP/USD on July 10, 2025

On the hourly chart, the GBP/USD pair continued its upward movement on Wednesday after rebounding from the 127.2% Fibonacci corrective level at 1.3527. The rebound was precise, leading

Samir Klishi 10:35 2025-07-10 UTC+2

GBP/JPY. Analysis, Forecast, and Current Market Situation

On Thursday, the GBP/JPY pair is regaining upward momentum and shows readiness for further growth. The formation of an ascending channel confirms the stability of the bullish trend. During

Irina Yanina 10:22 2025-07-10 UTC+2

If the resistance level of 0.7964 holds back its upward movement, USD/CHF has the potential to weaken on Thursday, July 10, 2025.

USD/CHF, Thursday, July 10, 2025 In addition to rumors of a planned Fed interest rate cut and falling US government bond yields, USD/CHF weakened today. Key Levels 1. Resistance

Arief Makmur 06:47 2025-07-10 UTC+2

Cable has the potential to test its Pivot and Support 1 levels in the near future, Thursday, July 10, 2025.

GBP/USD, Thursday, July 10, 2025. Rumors of the Fed's future dovish policy have created negative sentiment towards the USD, potentially helping the pound sterling strengthen again today. Key Levels

Arief Makmur 06:47 2025-07-10 UTC+2

EUR/USD Forecast for July 10, 2025

Markets continue to test risk-on strategies—yesterday, the S&P 500 rose by 0.61%, oil slipped by 0.22%, and the euro declined by just 4 points, which, given the low daily volatility

Laurie Bailey 06:14 2025-07-10 UTC+2
Can't speak right now?
Ask your question in the chat.
Widget callback
 

Dear visitor,

Your IP address shows that you are currently located in the USA. If you are a resident of the United States, you are prohibited from using the services of InstaFintech Group including online trading, online transfers, deposit/withdrawal of funds, etc.

If you think you are seeing this message by mistake and your location is not the US, kindly proceed to the website. Otherwise, you must leave the website in order to comply with government restrictions.

Why does your IP address show your location as the USA?

  • - you are using a VPN provided by a hosting company based in the United States;
  • - your IP does not have proper WHOIS records;
  • - an error occurred in the WHOIS geolocation database.

Please confirm whether you are a US resident or not by clicking the relevant button below. If you choose the wrong option, being a US resident, you will not be able to open an account with InstaForex anyway.

We are sorry for any inconvenience caused by this message.