signal strength 1 of 5
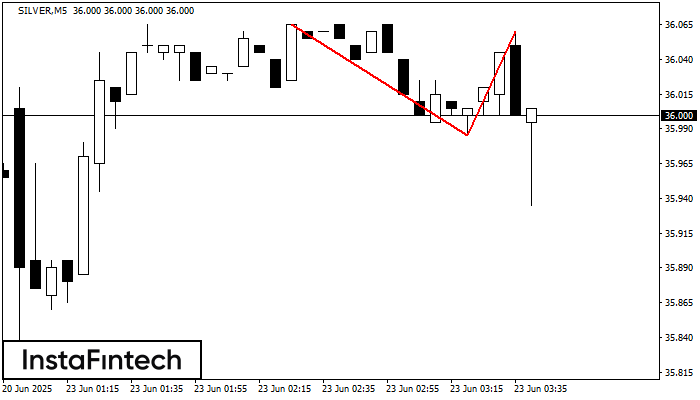
The Double Top reversal pattern has been formed on SILVER M5. Characteristics: the upper boundary 36.06; the lower boundary 35.98; the width of the pattern is 75 points. Sell trades are better to be opened below the lower boundary 35.98 with a possible movements towards the 35.97 level.
The M5 and M15 time frames may have more false entry points.
See Also
- All
- Double Top
- Flag
- Head and Shoulders
- Pennant
- Rectangle
- Triangle
- Triple top
- All
- #AAPL
- #AMZN
- #Bitcoin
- #EBAY
- #FB
- #GOOG
- #INTC
- #KO
- #MA
- #MCD
- #MSFT
- #NTDOY
- #PEP
- #TSLA
- #TWTR
- AUDCAD
- AUDCHF
- AUDJPY
- AUDUSD
- EURCAD
- EURCHF
- EURGBP
- EURJPY
- EURNZD
- EURRUB
- EURUSD
- GBPAUD
- GBPCHF
- GBPJPY
- GBPUSD
- GOLD
- NZDCAD
- NZDCHF
- NZDJPY
- NZDUSD
- SILVER
- USDCAD
- USDCHF
- USDJPY
- USDRUB
- All
- M5
- M15
- M30
- H1
- D1
- All
- Buy
- Sale
- All
- 1
- 2
- 3
- 4
- 5
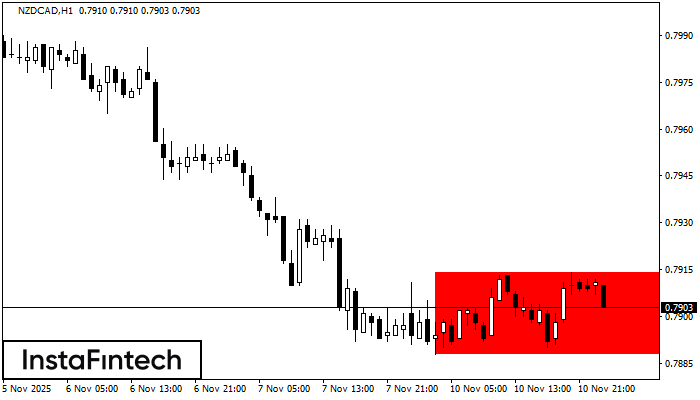
According to the chart of H1, NZDCAD formed the Bearish Rectangle which is a pattern of a trend continuation. The pattern is contained within the following borders: lower border 0.7888
Open chart in a new window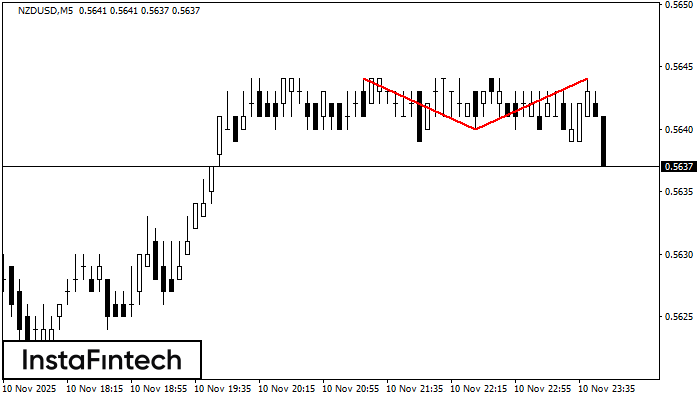
The Double Top pattern has been formed on NZDUSD M5. It signals that the trend has been changed from upwards to downwards. Probably, if the base of the pattern 0.5640
The M5 and M15 time frames may have more false entry points.
Open chart in a new window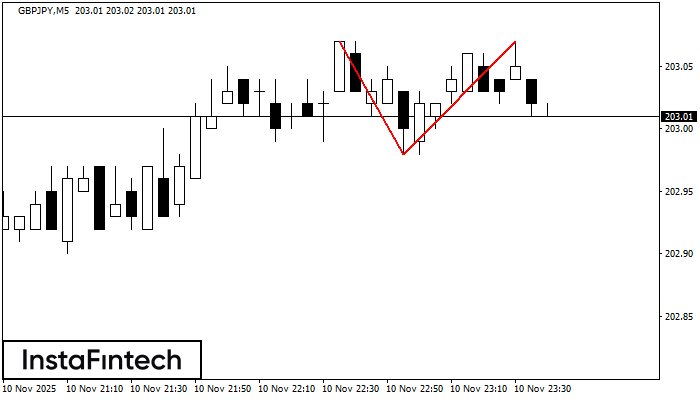
The Double Top reversal pattern has been formed on GBPJPY M5. Characteristics: the upper boundary 203.07; the lower boundary 202.98; the width of the pattern is 9 points. Sell trades
The M5 and M15 time frames may have more false entry points.
Open chart in a new window