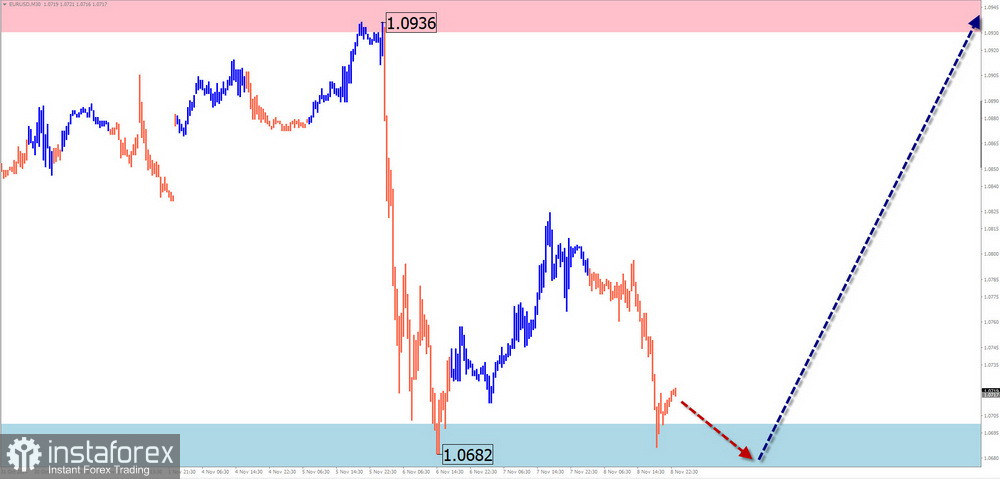
EUR/USD
Analysis: The short-term wave structure is downward, representing a correction within the primary trend. This wave started in late August and remains incomplete. While the structure appears mature, no signals of an imminent reversal are currently observed. The price has reached the upper boundary of the preliminary target zone for the current wave.
Forecast: The euro is expected to move sideways during the upcoming week. Temporary pressure near the support level may occur in the next couple of days. A potential reversal and growth toward the lower boundary of the resistance zone could follow. An increase in volatility is likely in the latter half of the week.
Potential Reversal Zones:
- Resistance: 1.0930/1.0980
- Support: 1.0700/1.0650
Recommendations:
- Buy: Consider buying after confirmed signals near the support zone.
- Sell: Selling lacks potential and could result in losses.
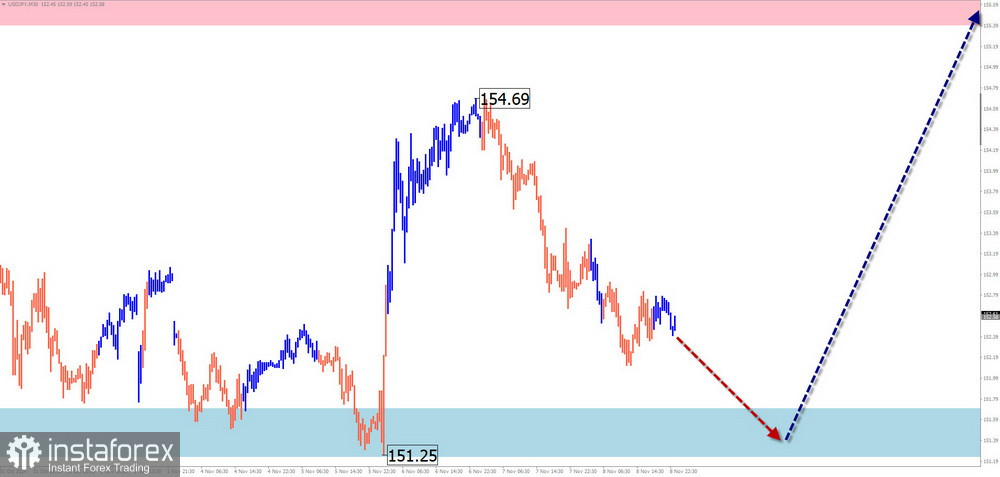
USD/JPY
Analysis: The weakening of the yen against the U.S. dollar has been evident since early August. The pair has reached a potential reversal zone on the weekly timeframe. The corrective wave, initiated in early October, remains incomplete. The downward movement starting November 6 concludes the correction but has not fully completed at the time of analysis.
Forecast: Further decline is likely early in the week, followed by sideways movement near the support zone. A reversal and resumption of price growth are expected later in the week, with the upward movement constrained by calculated resistance levels.
Potential Reversal Zones:
- Resistance: 155.40/155.90
- Support: 151.70/151.20
Recommendations:
- Buy: Consider buying after appropriate signals appear near the support zone.
- Sell: Selling is risky due to low potential; reduce volume sizes.
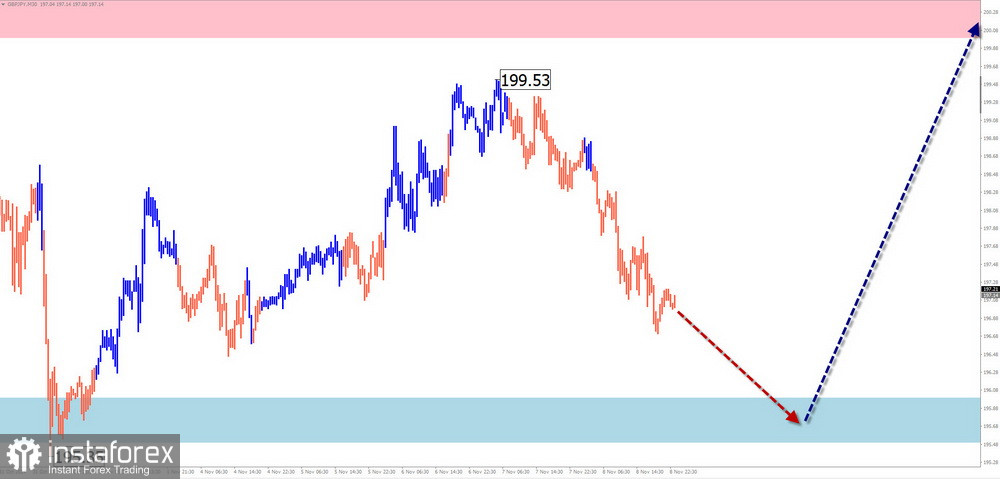
GBP/JPY
Analysis: The short-term chart for GBP/JPY shows a dominant upward trend over the past few months. The current wave segment, which began on September 11, remains incomplete. Over the past three weeks, the pair has formed a horizontal correction (Wave B), which has not yet concluded.
Forecast: Sideways movement with a downward bias is likely during the early part of the week, potentially testing the lower boundary of the support zone. A reversal and subsequent price growth are expected later in the week, potentially reaching the resistance zone.
Potential Reversal Zones:
- Resistance: 200.00/200.50
- Support: 196.00/195.50
Recommendations:
- Sell: Sales have low potential; consider reducing volume sizes.
- Buy: Suitable after reversal signals appear in your trading systems.
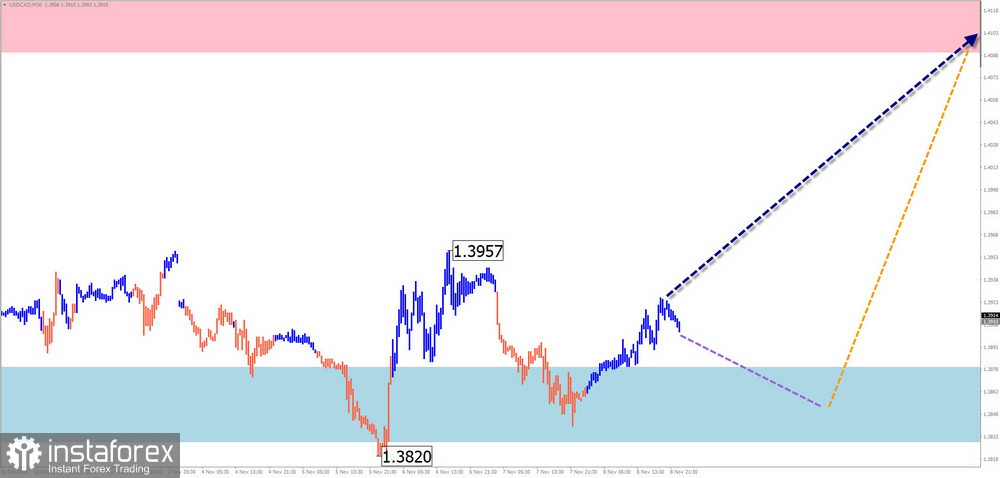
USD/CAD
Analysis: USD/CAD continues to develop an upward wave that began in September. The counter-trend wave from November 6 is corrective and lacks reversal potential. This segment of the wave remains incomplete and coincides with the potential reversal zone on the daily timeframe.
Forecast: Sideways movement is expected for the next few days, with potential reversal conditions forming near the support zone. A directional change is likely by the weekend, with resistance levels indicating the upper boundary of the anticipated weekly range.
Potential Reversal Zones:
- Resistance: 1.4090/1.4140
- Support: 1.3880/1.3830
Recommendations:
- Buy: Consider buying after confirmed signals in your trading systems.
- Sell: Selling is risky and may result in losses.
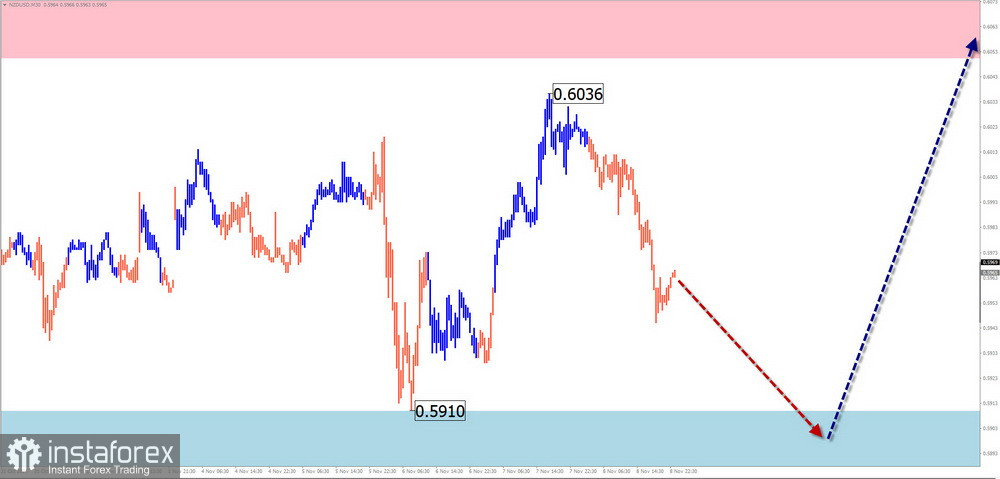
NZD/USD
Analysis: Since late August, the NZD/USD chart has displayed a downward horizontal wave structure resembling an extended flat. The wave remains incomplete, and the price is approaching the upper boundary of the weekly potential reversal zone.
Forecast: The downward trajectory is likely to continue this week, with sideways consolidation possible early in the week. A reversal and increased volatility are expected near the calculated support zone, with potential penetration of the lower boundary.
Potential Reversal Zones:
- Resistance: 0.6050/0.6100
- Support: 0.5910/0.5860
Recommendations:
- Sell: Use smaller volume sizes during individual sessions.
- Buy: Premature until the current decline fully concludes.
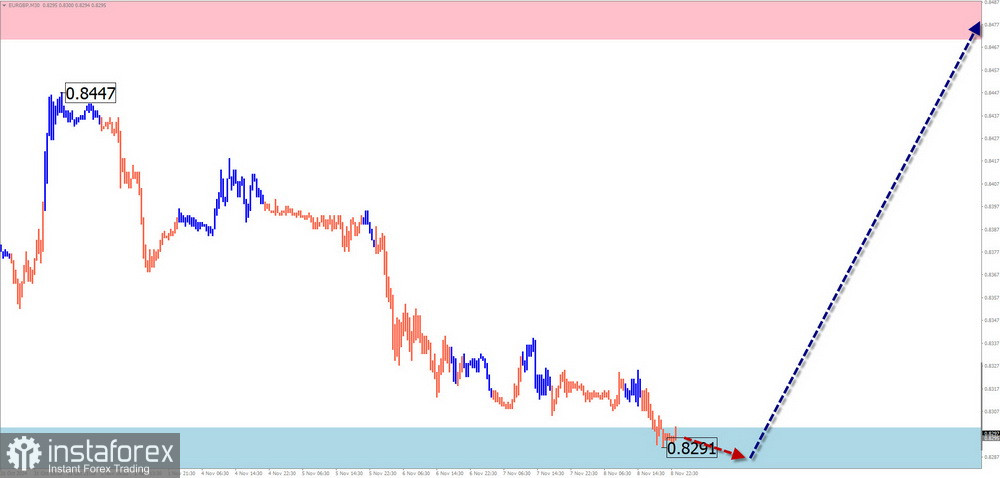
EUR/GBP
Analysis: The incomplete wave structure for EUR/GBP has been downward since August 5, forming the final segment of Wave C. The wave structure is not yet complete, and the pair has reached the upper limit of the weekly potential reversal zone.
Forecast: Sideways movement is expected over the next few days. A direct break below the support zone is unlikely. Toward the end of the week, increased volatility may signal a reversal and the start of upward movement.
Potential Reversal Zones:
- Resistance: 0.8470/0.8520
- Support: 0.8300/0.8250
Recommendations:
- Buy: Suitable after reversal signals appear near the support zone.
- Sell: Use smaller volume sizes during individual trading sessions.
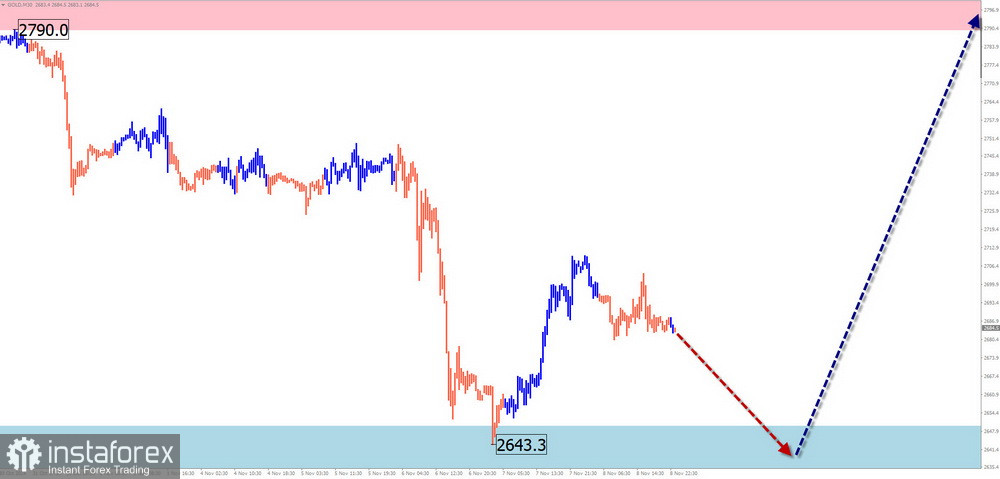
Gold
Analysis: The current wave structure for gold is upward, starting on October 3. Over the past three weeks, a horizontal correction (Wave B) has developed near strong resistance, which remains incomplete at the time of analysis.
Forecast: The downward movement is expected to conclude in the next few days, with sideways consolidation forming near the support zone. Price growth is likely to resume by the end of the week, with resistance levels indicating the upper boundary of the weekly range.
Potential Reversal Zones:
- Resistance: 2790.0/2840.0
- Support: 2650.0/2600.0
Recommendations:
- Buy: High risk; trades may result in losses.
- Sell: Consider selling after reversal signals appear near resistance.
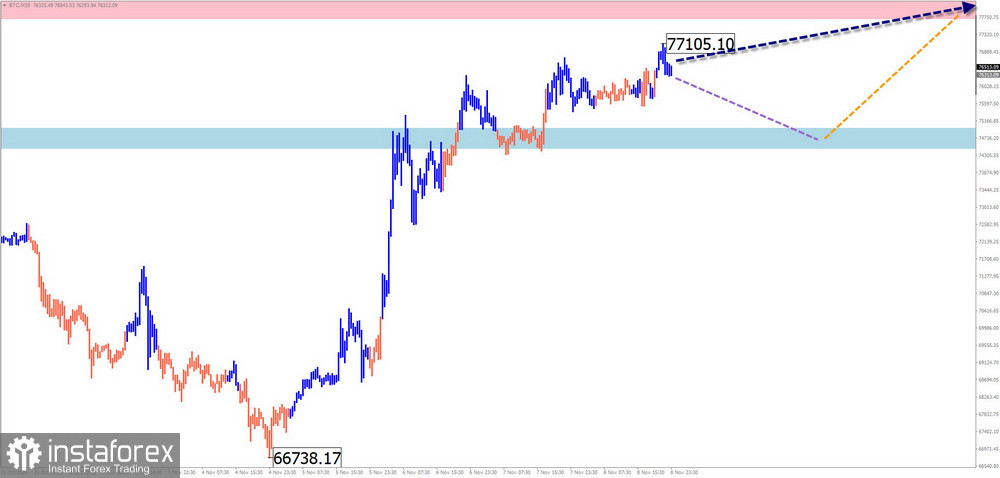
Bitcoin
Analysis: Bitcoin's ongoing upward wave structure has been developing since August 5, indicating the start of another segment of the bullish trend. The price has reached the lower boundary of the weekly potential reversal zone.
Forecast: Bitcoin is expected to continue rising over the next few days, potentially testing the calculated resistance levels. A breakout beyond the upper boundary is unlikely. By the end of the week, increased volatility may lead to a reversal and renewed downward movement.
Potential Reversal Zones:
- Resistance: 77730.0/77930.0
- Support: 75000.0/74800.0
Recommendations:
- Sell: Suitable after reversal signals appear near resistance.
- Buy: Use smaller volume sizes during individual sessions.
Note: Simplified Wave Analysis (SWA) interprets waves as consisting of three parts (A-B-C). The analysis focuses on the most recent incomplete wave on each timeframe. Dotted lines indicate expected movements.
Disclaimer: Wave algorithms do not account for the duration of movements over time.